Intradayは、12:00 AM~11:45 PMの1日を24時間表記で表示します。 1日は15分間隔に分割されます。 この間隔とメトリック![]() コンタクトセンターの状況を把握するために測定できる統計データ。を使って各スキル
コンタクトセンターの状況を把握するために測定できる統計データ。を使って各スキル![]() 従業員の専門分野。スキルには、特定の言語の流暢さや、営業やテクニカルサポートなどのビジネススキルが含まれます。のパフォーマンスを確認できます。 それらを予測データと比較したり、スケジュールを更新する必要がある領域を特定したりすることもできます。
従業員の専門分野。スキルには、特定の言語の流暢さや、営業やテクニカルサポートなどのビジネススキルが含まれます。のパフォーマンスを確認できます。 それらを予測データと比較したり、スケジュールを更新する必要がある領域を特定したりすることもできます。
センターに、着信電話、チャット、テクニカルサポートという3つのスキルがあるとします。
センターが朝のシフトに1時間あたり100件の通話、50件のチャットリクエストがあると予測しました。
しかし、予期しないことが起こった場合はどうなりますか? 11:00に、1時間あたり20件の通話しか受信しなかったが、90件のチャットリクエストがあったことがわかります。
人員配置を調整することをお勧めします。 着信電話スキルの人員配置を減らし、エージェントがチャットリクエストに対応する時間を増やすことができます。
イントラデイマネジャーの機能:
-
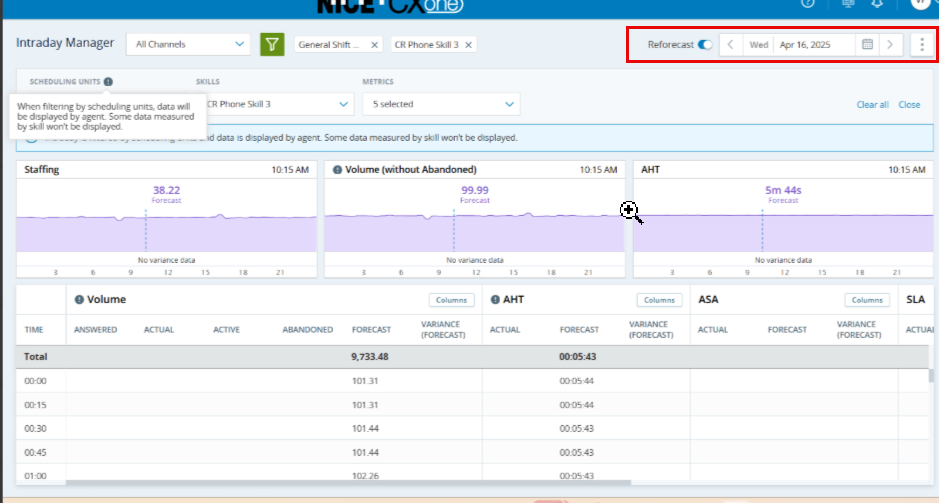
ウィジェット:ページ上部にIntradayデータが含まれる行がさまざまなグラフで表示されます。
オプション
 >ウィジェットを折りたたむをクリックすると、ウィジェットの行を折りたたむことができます。
 -
Intradayテーブル:ウィジェットの下に、データの詳細が正確な数値付きで表示されます。
デフォルトでは、イントラデイマネジャーを開いた時に、すべてのスキルとメトリックがテーブルで表示されます。 表示するデータはフィルタリングできます。 次にIntradayを開く時は、フィルタリングした条件に基づいてスキルが表示されます。
Intradayの詳細:
-
フォーキャストデータは、スケジュールを生成するために使用したフォーキャストに基づいています。 スケジュールを公開すると、Intradayが新しいフォーキャストデータで更新されます。
-
デフォルトでは、Intradayに表示される時間はユーザーのローカルタイムゾーン用です。
ニューヨークのマネージャーが、カリフォルニアのスケジューリングユニット用にイントラデイマネージャーを使用しているとします。 Intradayに表示される時間は、ニューヨークのタイムゾーンに基づいています。
ただし、設定パネルからタイムゾーンを変更できます。
-
Intradayに表示されるデータは、WEMスキルに関するものであり、ACDスキルに関するものではありません。 Intradayは、ACDスキルに割り当てられていないエージェントまたはWEMスキルのデータを表示しません。
 例を見る
例を見る
English_Callsに対応したエージェントは5人います。 WEMスキルが割り当てられていない場合があります。
-
エージェント:それらのエージェントの1人が、 のWEMEnglish_CallsCXone Mpower Adminスキルに割り当てられていないとします。 この場合、イントラデイは4つのエージェントのデータのみを表示します。
-
ACDスキル:ACDスキルがEnglish_Calls WEMスキルに割り当てられていない場合、intradayは5人のエージェントすべてのデータを表示しません。
-
Intradayは、ACDから受信したデータと、アクティブなフォーキャストおよびスケジュール管理を使用します。
ウィジェット
イントラデイマネジャーウィジェットは、人員配置![]() 選択された期間内にオープン状態だったエージェントの人員配置データ。、量
選択された期間内にオープン状態だったエージェントの人員配置データ。、量![]() デジタル投稿やコメントを含む、通常は特定の期間内に行われたインタラクションの総数。、またはAHT
デジタル投稿やコメントを含む、通常は特定の期間内に行われたインタラクションの総数。、またはAHT![]() 平均対応時間は、エージェントがインタラクションの処理に費やした平均時間です。です。 スケジューリングユニットでフィルタリングする場合、量ウィジェットには放棄済み
平均対応時間は、エージェントがインタラクションの処理に費やした平均時間です。です。 スケジューリングユニットでフィルタリングする場合、量ウィジェットには放棄済み![]() システムに入ったものの、エージェントに接続される前に終了したインタラクション。コンタクトが電話を切った場合など。のデータは含まれません。 ウィジェットのタイトルは量(放棄なし)になります。
システムに入ったものの、エージェントに接続される前に終了したインタラクション。コンタクトが電話を切った場合など。のデータは含まれません。 ウィジェットのタイトルは量(放棄なし)になります。
ウィジェットの上部には、ウィジェット名 (人員配置、量、またはAHT)と、データが表示されている間隔が表示されます。 たとえば、11:00間隔のデータを表示しているとします。 表示されている時刻は11:00です。
ウィジェットには、完了した最新の間隔のデータが表示され、点線の垂直線で表されます。 11:22にウィジェットを見たとします。 表示されるデータは11:00間隔のもので、グラフには点線が表示されます。
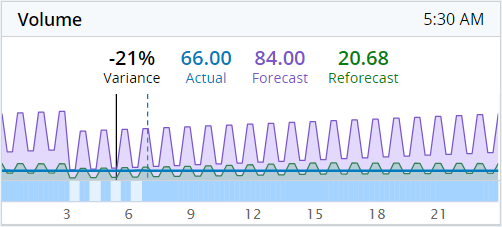
グラフの上にカーソルを合わせると、さまざまな間隔のデータが表示されます。 カーソルを合わせた間隔は、実線の垂直線で表されます。 たとえば、9:00のグラフの1つにカーソルを合わせるとします。 各ウィジェットに表示されるデータは、差異、実際、予測、再予測の値など、9:00間隔に応じて変化します。 ウィジェットの隅で、時刻が9:00に変わります。 点線は引き続き、最新の完了した間隔を表します。
データがない間隔にマウスを合わせることはできないことに注意してください。 そうすると、実線はデータに最も近い間隔にジャンプします。
-
差異、実際、予測、および再予測の値。 これらの値はIntradayテーブルのものです。
いずれかの値が欠落している場合、ウィジェットには表示されません。 予測データがない場合などです。 ウィジェットには、差異、実際、再予測の値が表示され、予測は表示されません。
差異は、実際の値と予測値の間のパーセンテージです。 たとえば、人員配置ウィジェットの実際の値は20で、予測は50です。 この場合、差異率は-60%になります。
ACDは間隔が終了してからWFMに送信するまでに数分の処理時間があるため、データが画面に表示されるまでに数分かかる場合があることに注意してください。 たとえば、11:15の間隔は11:30に終了します。 ウィジェットを見ると、予測データはすぐに表示されますが、実際のデータは11:35まで表示されません。 実際のデータが更新されない場合は、ACDプロバイダーからデータを取得する際に遅延が発生する可能性があります。
-
値の下には、1日の時間帯ごとに測定された値の線グラフが表示されます。 各グラフの色は異なる値を表します。 各グラフには、値のボリューム(縦軸)が15分間隔(横軸)で表示されます。
-
有効になっている場合、グラフの下には差異のしきい値(色分け)を示すバーが表示されます。 分散しきい値は、グラフの下にヒートマップとしても表示されます。
-
ウィジェットの下部にあるタイムバー。 時間は、終日ではなく、組織の実際の労働時間に基づきます。 たとえば、ウィジェットは午前9時から午後5時(9:00-17:00)までのデータを表示できます。
 ウィジェットで時間が表示される方法
各日の開始と終了は、スケジューリングユニットの営業時間と受信データに基づいて決定されます。
たとえば、3つのスケジューリングユニットの営業時間は次のとおりです。
-
SU1:8:00-16:00
-
SU2:8:30-16:30
-
SU3:9:00-17:00
スケジューリングユニットの1つだけを表示するようにフィルターした場合でも、ウィジェットには08:00から17:00までのデータが表示されます。 営業時間を超えたデータを受信した場合、それに応じて時間が調整されます。 この例では、エージェントが午前7:00に早めにインタラクションの対応を開始したとします。 この場合、ウィジェットの時間は7:00から17:00までになります。
-
表示用に選択する日を変更すると、データが変化します。 あなたが確認している場合:
-
今日:グラフには、1日の始まりから現在の時刻までのデータが表示されます。
-
明日:グラフには、可能な場合、 予測のデータのみが表示されます。
-
将来の日:グラフには、公開済みスケジュールの予測データのみが表示されます。 たとえば、今後2週間のスケジュールを生成したとします。 この2週間の予測データはイントラデイで確認できます。
-
過去の1日:グラフには、その日のすべてのデータが表示され、現在の15分間隔に対応する赤い線が表示されます。 実際の値、予測値、および再フォーキャスト値は、その赤い線に従っています。
イントラデイマネジャーを火曜日の11:22に開き、月曜日のイントラデイデータを確認するとします。 ウィジェットには、その日の11:00~11:15間隔の値が表示されます。
量ウィジェットは量(棄権なし)に変化し、選択したスケジューリングユニットにより処理されたコールの数を表示します。
ウィジェットは応答済みインタラクションのデータを表示するため、実際とフォーキャストのデータに以下のような差異が生じる場合があります。
-
フォーキャスト値には、応答済みおよび放棄済みインタラクションの両方のデータが含まれます。
-
実際値には、応答済みコールのみのデータが含まれます。 放棄済みインタラクションは処理済みとは見なされません。
Intradayテーブル
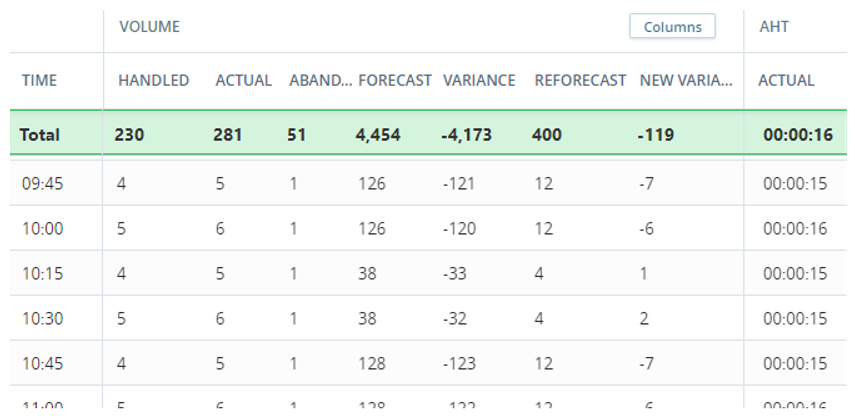
テーブルには、選択した日の15分間隔のメトリックの内訳が表示されます。 各間隔のデータは、ACDの処理時間により数分後に更新されます。 たとえば、11:00時間枠のデータは11:20頃に表示されます。 表示される時間は、ローカルタイムゾーンに基づいていることに注意してください。
デフォルトでは、すべてのスキルとメトリックがテーブルで表示されます。 表示するデータはフィルタリングできます。 次にIntradayを開く時は、フィルタリングした条件に基づいてスキルが表示されます。
ウィジェットの行を折りたたんでテーブルを展開するには、 オプション >ウィジェットを折りたたむをクリックします。
強調表示された合計行には、各列の集計結果が表示されます。 AHT、AHT、およびASAメトリックの場合、これは集計平均です。
11:22にイントラデイマネジャーを開いたとしましょう。 この表には、11:15行までの各間隔のデータが表示されます。 合計行には、11:00のインターバルまでの各列の集計結果が表示されます。
バックログ列は、合計行に合計や平均ではなく最終期間の値が表示される特別なケースです。 これは、バックログの値に、複数の間隔で現れる同じインタラクションが含まれる可能性があり、これらの値を合計しても真のバックログを正確に反映できないためです。 これにより、1日の始まりと比べて、1日の終わりにステータスがどのように変化したかをより明確に把握できます。
たとえば、最終更新間隔が10:00で、バックログの値が9:30に557、9:45に558、10:00に559の場合、合計行には559と表示されます。最後の間隔。
留意事項:
-
AHTは間隔ごとに計算されこれは1日全体の加重AHTです。
-
ボリュームメトリックの実際のデータには、応答通話、放棄通話、およびアクティブ通話(TTIが実装されている場合はアクティブ)が含まれます。 これは、15分以上続くインタラクションが複数回カウントされることを意味します。 たとえば、10分間続いた通話(同じ間隔で開始および終了)と20分間続いた通話(2つの間隔にまたがる)を受信した場合、実際のデータの合計は3になります。
-
将来の日を見る場合、予測データの合計値が1日分となります。
チャンネルの種類に基づいて表示できるテーブルのデータ:リアルタイム![]() 通話や対面のミーティングなど、すぐに対応しなければならないリアルタイムのインタラクション。、遅延可能
通話や対面のミーティングなど、すぐに対応しなければならないリアルタイムのインタラクション。、遅延可能![]() Eメールなど、後で処理できるインタラクション。、または全チャンネルです。
Eメールなど、後で処理できるインタラクション。、または全チャンネルです。
スキルでフィルタリングする場合、使用可能なオプションは選択したチャンネルタイプに依存します。 随時対応チャネルの場合は、随時対応が可能なタイプのスキルのみを選択できます。
各チャンネルタイプに表示されるスキルは、チャンネルタイプを切り替えたときに保存されます。 たとえば、リアルタイムチャンネルを選択したとします。 すると、15個のリアルタイムスキルのうち10個が設定されます。 延期可能チャンネルを選択すると、その10個のスキルはディファレンブルではないので表示されません。 リアルタイムチャンネルに戻ると、10個のスキルが自動的に選択されます。
各スキルのチャンネルタイプは、WEMスキルページで確認できます。 各スキルは1つのチャンネルにのみ割り当てることができます。 たとえば、英語通話というスキルを見ています。 このスキルは音声チャンネルに割り当てられています。 音声チャンネルはリアルタイムのインタラクションです。
イントラデイでは、インバウンドおよびアウトバウンド(ダイヤラー![]() 顧客リストに自動的に電話をかけるサービス。を含む)のインタラクションのデータが表示されます。
顧客リストに自動的に電話をかけるサービス。を含む)のインタラクションのデータが表示されます。
Cisco UCCXを使用しているユーザーは、チャンネルやスケジューリング単位でフィルタリングすることはできません。
イントラデイテーブルでは、一部のメトリックがエージェントではなくスキルごとに計算されます。 たとえば、ボリュームの[放棄済]列がこれに該当します。 これらのメトリックをエージェントのグループで分割することはできません。
たとえば、スケジューリングユニットが3つあり、そのうちの1つでフィルタリングしているとします。 放棄されたデータは表示されません。 このデータはエージェントごとではなく、スキルごとに放棄されたインタラクションの数で測定されています。
一部のメトリックはスキルごとに計算されるため、
-
計算できないデータを含む列は空になります。 その際には以下の手順が必要です。
-
すべてのASA列
-
すべての SLA 列
-
ボリュームの[実際]列と[放棄済]列
-
-
ボリュームの実績列と予測列の間に不一致がある場合があります。
予測データはスキル別、実際のデータはエージェント別に表示されます。 予測データは、人員配置プランを作成する際にスキルごとに生成されるため、エージェント別の予測はありえません。 この差異は、予測と実際のデータが異なるソースから取得されるために生じる可能性があります。
スキルの通話量予測で12:00に100件のインタラクションが予想されています。 そのスキルを処理できるスケジューリングユニットは3つあります。
現在13:00で、12:00のインターバルをチェックします。 スケジューリングユニットでフィルタリングしていない場合、次のように表示されます。
-
予測:100
-
実際:98
これは、コールセンターがその間に98件のインタラクションを受け、予測がほぼ正確だったことを意味します。
スケジューリングユニットの1つでフィルタリングすると、イントラデイは、選択されていない2つのユニットからデータを削除します。 次のように表示されます。
-
予測:100
-
実際:75
実際のデータは、選択したスケジューリングユニットが何件のインタラクションに応答したかを示しますが、フォーキャストは引き続きスキルに基づいています。 これにより、このユニットが予測された量のうち何件のインタラクションに応答したかがわかります。
差異列のセルを色分けして、差異が大きい箇所や小さい箇所を強調表示することができます。 色は、メトリックの差異しきい値に従って定義されます。
こうすると、注意が必要なメトリックがあるかどうかを確認できます。
テーブルに表示されるもの
テーブルのデータは、延期可能![]() Eメールなど、後で処理できるインタラクション。またはリアルタイム
Eメールなど、後で処理できるインタラクション。またはリアルタイム![]() 通話や対面のミーティングなど、すぐに対応しなければならないリアルタイムのインタラクション。のチャネルに従って表示できます。 また、すべてのチャネルのデータを表示することもできます。 イントラデイでは、インバウンドおよびアウトバウンド(ダイヤラー
通話や対面のミーティングなど、すぐに対応しなければならないリアルタイムのインタラクション。のチャネルに従って表示できます。 また、すべてのチャネルのデータを表示することもできます。 イントラデイでは、インバウンドおよびアウトバウンド(ダイヤラー![]() 顧客リストに自動的に電話をかけるサービス。を含む)のインタラクションのデータが表示されます。
顧客リストに自動的に電話をかけるサービス。を含む)のインタラクションのデータが表示されます。
テーブル内のメトリック:
これは、ACDによって報告される平均処理時間を表します。 複数のACDスキルAHTを持つWFMスキルは、そのWFMスキルのすべてのACDスキルの加重平均に基づいて計算されます。
-
合計AHTは、すべてのインターバルの平均を示します。
-
合計AHTは、スキルではなく、通話量ごとに計算されます。
たとえば、スキルAでは通話量が3で、AHTが15分だとします。 そして、スキルBでは通話量が2で、AHTが10分だとします。 合計AHTは通話量により計算され、この値は5です(スキルAの3 + スキルBの2)。 したがって、AHTは次のように13:00となります。
(3×15 + 2×10) ÷ 5 = 13
-
実績 -ACDからのメトリックの現在値。
-
予測:その日のその時間の元の予測値。
 イントラデイのフォーキャストデータとフォーキャストジョブが同じでない場合
フォーキャストジョブを作成すると、システムはフォーキャストデータを2段階で計算します。 まず、必要なスキルに基づいて、フォーキャストデータでデータが生成されます(予測のステップ3)。 次に、システムは複数のスケジューリングユニットに仕事量を分散させることで、フォーキャストデータを改善することができます。 人員配置パラメーターを定義した後(ステップ4)、データが再生成されます。 その際、インタラクションを処理できるスケジューリングユニットも計算で考慮されます。 これにより、可能な限り正確なフォーキャストデータを得ることができます。 フォーキャストデータが人員配置で更新されます(ステップ5)。
フォーキャストジョブに基づいてスケジュールを作成する場合、そのフォーキャストデータはステップ5のデータに基づいています。 最終的なフォーキャストデータはイントラデイのフォーキャストの列にも表示されます。
-
差異:実績値と予測値の間の差異。
-
再フォーキャスト:ACDからの受信データに基づく、その日の残りの新しいフォーキャスト。 再予測が有効になっている場合にのみデータを表示します。
-
差異(再フォーキャスト):再フォーキャストとACDからの実際のトレンドとの差異。 再予測が有効になっている場合にのみデータを表示します。
ボリュームメトリックは、ACDによって報告された合計ボリュームを表します。
表の列:
-
Received:回答かどうかに関係なく、その間隔中に受信したインタラクションの数。 イントラデイは2024年8月に受信データの収集を開始しました。 それ以前のデータは表示されません。
-
応答済:そのインターバル中に開始されたインタラクションの数。
-
アクティブ:前回のインターバルから継続したインタラクションの数。
-
放棄済:そのインターバル中に放棄されたインタラクションの数。
スケジューリングユニットでフィルタリングする場合(Cisco UCCX使用のユーザーにはご利用いただけません)、このメトリクスのデータは空白になります。 Intradayが受信するデータはスキル単位であり、スケジューリング単位での分割はできません。
-
実際:その間隔に応答済みアクティブアクティブ(NICE ACD統合が存在する場合)、および放棄されたインタラクションの数:
実際=応答済+アクティブ+放棄済
ここで、合計行の実際のデータには、アクティブデータが含まれていることに注意してください。 また、インターバルごとのインタラクションの総量を示すアクティブも含まれています。 つまり、15分を超える場合は1つのインタラクションを複数回含めることができます。
 CXone Mpower ACDを持つユーザーの実際のボリュームの計算方法
実際列のボリュームは、ACDから取得されます。
ACDを使用している場合、実際のボリュームは、ACDからのこれらの値の合計になります( データ辞書を参照)。
アクティブは、ACDに依存する存在する場合にのみTTIに関連します。
-
破棄%:15分ごとに放棄された通話の割合。 表示される値は小数点以下が四捨五入されます。 レポートで正確な値を確認できます。
-
予測:その日のその時間の元の予測値。 2024年4月以前のデータは小数点以下が四捨五入されます。 レポートで正確な値を確認できます。
 イントラデイのフォーキャストデータとフォーキャストジョブが同じでない場合
フォーキャストジョブを作成すると、システムはフォーキャストデータを2段階で計算します。 まず、必要なスキルに基づいて、フォーキャストデータでデータが生成されます(予測のステップ3)。 次に、システムは複数のスケジューリングユニットに仕事量を分散させることで、フォーキャストデータを改善することができます。 人員配置パラメーターを定義した後(ステップ4)、データが再生成されます。 その際、インタラクションを処理できるスケジューリングユニットも計算で考慮されます。 これにより、可能な限り正確なフォーキャストデータを得ることができます。 フォーキャストデータが人員配置で更新されます(ステップ5)。
フォーキャストジョブに基づいてスケジュールを作成する場合、そのフォーキャストデータはステップ5のデータに基づいています。 最終的なフォーキャストデータはイントラデイのフォーキャストの列にも表示されます。
-
差異(フォーキャスト):実績値とフォーキャスト値の間の差異。 2024年4月以前のデータは小数点以下が四捨五入されます。 レポートで正確な値を確認できます。
-
再フォーキャスト:ACDからの着信データに基づく、その日の残りの新しいフォーキャスト。 再予測が有効になっている場合にのみデータを表示します。 2024年4月以前のデータは小数点以下が四捨五入されます。 レポートで正確な値を確認できます。
-
差異(再フォーキャスト):再フォーキャストとACDからの実際のトレンドとの差異。 再予測が有効になっている場合にのみデータを表示します。 2024年4月以前のデータは小数点以下が四捨五入されます。 レポートで正確な値を確認できます。
エージェントと話すオプションを選択した後、エージェントがインタラクションに応答するのにかかった平均時間。
スケジューリングユニットでフィルタリングする場合(Cisco UCCX使用のユーザーにはご利用いただけません)、このメトリクスのデータは空白になります。 Intradayが受信するデータはスキル単位であり、スケジューリング単位での分割はできません。
-
実際:ACDからのメトリックの現在値。
-
予測:その日のその時間の元の予測値。
-
差異(フォーキャスト):実績値とフォーキャスト値の間の差異。
-
再フォーキャスト:ACDからの受信データに基づく、その日の残りの新しいフォーキャスト。 再予測が有効になっている場合にのみデータを表示します。
-
差異(再フォーキャスト):再フォーキャストとACDからの実際のトレンドとの差異。 再予測が有効になっている場合にのみデータを表示します。
-
予測:最新のスケジュールの再シミュレーションに基づく期待値。 再予測が有効になっている場合にのみデータを表示します。
-
差異(投影):投影された値とACDからの実際の着信データの差異。 データのみを表示し、投影されたデータが利用可能な場合に表示します。
定義されたサービスレベルアグリーメントのしきい値内でエージェントが応答した合計インタラクションの割合。
たとえば、エージェントに20秒以内にコールに応答させます。 エージェントが20秒以内に100回の通話のうち60回に応答した場合、SLAは60です。
ステップ4からのSLAは暫定的なターゲットであり、フォーキャスティングプロセスが完了すると更新されます。 SLA値が異なるのはそのためです。
イントラデイでは、公開済みスケジュールのSLAのみが表示されます。 未来の日付のSLA値を見るには、その時間のスケジュールを公開し、イントラデイでSLAを確認します。
スケジューリングユニットでフィルタリングする場合(Cisco UCCX使用のユーザーにはご利用いただけません)、このメトリクスのデータは空白になります。 Intradayが受信するデータはスキル単位であり、スケジューリング単位での分割はできません。
-
実際:ACDからのメトリックの現在値。
-
予測 -予測された人員配置計画から得たメトリックの元の予測値。
ここでのSLA値は予測する時に定義されたものですが、実際の列のSLA値はACDから取得されます。 つまり、同じメトリックに対して異なる値が存在する可能性があるということです。
ACDのSLAは、60秒以内にコールの80%に応答するように定義されています。人員配置計画では120秒以内に80%で定義されているとしましょう。 このケースでは、実際の値と予測値は異なっています。
列の値では、2つの数値が表示されています。 たとえば、80/30をご確認ください。 最初の値はSLAであり、2番目の値はエージェントのインタラクションの応答速度です。 つまり、この例では、 30秒以内にインタラクションの80%に回答します。
-
差異(フォーキャスト):実績値とフォーキャスト値の間の差異。
-
再フォーキャスト:ACDからの受信データに基づく、その日の残りの新しいフォーキャスト。 再予測が有効になっている場合にのみデータを表示します。
-
差異(再フォーキャスト):再フォーキャストとACDからの実際のトレンドとの差異。 再予測が有効になっている場合にのみデータを表示します。
-
予測:最新のスケジュールの再シミュレーションに基づく期待値。 再予測が有効になっている場合にのみデータを表示します。
-
差異(投影):投影された値とACDからの実際の着信データの差異。 投影データが利用可能な場合と場合にのみデータを表示します。
イントラデイをチェックする際は、実績値と予測値を比較することが重要です。 予測値は、現在のスケジュールに基づいてSLAがどのようになるかを示しています。 これらを比較することで、SLAが予想されたものと比較してどれだけうまく機能しているかを確認できます。 また、将来の日付を見て、投影された値が期待どおりかどうかを確認するのも良いでしょう。 そうでない場合は、スケジュールを調整する必要がある場合があります。
非CXone Mpower ACDを使用する場合、エージェントレベルのデータが受信されないと、実際のデータが正確でなくなる可能性があります。 エージェントレベルのデータを受信していない場合、イントラデイはスキルレベルのデータに従ってデータを表示します。
-
実際:その時間間隔内で、によって
 エージェントの作業負荷を示す単位。勤務時間内と見なされたエージェントの
 対話の終了後にエージェントが作業要件を完了できるようにする状態。フルタイム換算値ACD(FTE)。 値は、勤務時間内の個々のエージェント数ではなく、FTEとしてレポートされます。
 詳細を表示
詳細を表示
これらは、エージェントがによってオープンACDと見なされる状態です:
-
インタラクションの応答に利用可能。
-
インタラクションの処理。
次に、エージェントが勤務時間内と見なされた時間の合計を15(1間隔の分数)で割ります。 これにより、実際列の値が得られます。
 例を見る
例を見る
アンナ、ケリー、マーティンの3人は11:15から11:30まで勤務する予定でした。 その間に、以下を行いました。
-
アンナは、9分間勤務時間内であると見なされました。その間に彼女は4分間通話できる状態で、2分間で1本の通話を処理し、3分間後処理を行いました。 残りの6分間は休憩していました。
-
ケリーは15分間ずっと通話を処理していました。
-
マーティンは6分間、インタラクションを処理できる状態でした。 その後、9分間ミーティングに参加しました。
アンナは9分間、ケリーは15分間、マーティンは6分間、勤務時間内でした。 合わせて、勤務時間内は30分間でした。
3人のエージェントが勤務時間内だった時間(30分)を1間隔の分数(15分)で割ります。
エージェントが勤務時間内だった30分 ÷ 間隔の長さ15分 = 2 FTE
その時間間隔に3人のエージェントが勤務予定だったにもかかわらず、実際値は2になります。
-
-
必須:その時間間隔内でインタラクション(通話やチャットなど)を処理するために必要なエージェントのフルタイム換算
 エージェントの作業負荷を示す単位。(FTE)数。 この数は、スケジュールの生成に使用されたフォーキャストまたは人員配置計画から直接取得されます。
 例を見る
例を見る
たとえば
-
15分間隔で6つのコールを処理することを想定しています。 平均的な通話には10分かかります。 これは、15分の間隔で、エージェントが60分間対応可能である必要があることを意味します(1コールあたり10分×6コール= 60分)。
この場合、必要な人員は4.00になります。 なんで? 15分間のインタラクションを処理する4人のエージェントは60に等しいためです。
-
15分間隔で7つのコールを処理することを想定しています。 平均的な通話には10分かかります。 これは、15分の間隔の間、エージェントが70分間利用可能である必要があることを意味します。
この場合、必要な人員配置は4.67(70分の合計処理時間÷15分の間隔= 4.67)になります。
-
-
予定:その時間間隔内の対話を処理するためにオープンになるようにスケジュールされているエージェントのFTE数。
 例を見る
例を見る
15分間隔で4つのエージェントが開いているとします。
これは、エージェントがその15分の時間間隔の間に合計60分間開いていることを意味します。 ご覧の人員配置は4.00です。 なんで? 営業時間の合計60分をその間隔の15分で割ると4になるからです。
その間、これらのエージェントのうち2人は10分間の休憩を取ります。 これは、エージェントがその15分の時間間隔の間に合計40分間開いていることを意味します。 ご覧の人員配置は2.67です。 なんで? 営業時間の合計40分をその間隔の15分で割ると2.67になるからです。
-
実際の差異:オープンエージェントの実際の数とフォーキャストで必要とされた数の差異。
-
予定された差異:オープンとしてスケジュールされた元のエージェント数とフォーキャストで必要とされた数の差異。
以下についての詳細情報:
空白のセルが表示される場合:
-
実際列:これは、ACDから受信されたデータがなかったことを意味します。 15分を超えて継続する場合は、管理者に連絡してください。
値が0のときは、その間に通話がありませんでした。
-
フォーキャスト列:その日のフォーキャストを実行しなかったか、営業時間外であることを意味します。
-
再フォーキャスト列:以下の場合、再フォーキャストのセルが空白になることがあります。
-
少なくとも4時間はフォーキャストまたはACDデータがありません。 WFMが今後の再フォーキャスト間隔を生成する前に、少なくとも4時間のフォーキャストまたはACDデータが必要です。
たとえば、コンタクトセンターが8時に開く場合、再予測データは12時から利用可能になります。
-
1日の始まりから各間隔のフォーキャストデータまたはACDデータが0の場合。
たとえば、フォーキャスト列を見て、以前のすべての間隔の値が0であることを確認したとします。 この場合、再予測データはありません。
-
それ以外の場合、内部エラーが発生した可能性があります。 再フォーキャストをクリックします。 これで問題が解決しない場合は、管理者に連絡してください。
-
表示用に選択する日を変更すると、データが変化します。 あなたが確認している場合:
-
今日:表には、1日の始まりから現在の時刻までのデータが表示されます。
-
明日:テーブルに表示されるのは、スケジュールされたデータとフォーキャストデータ(利用可能な場合)だけです。
-
将来の日:予定された予測データがテーブルに表示されます。 これには、すべての列の予測データと、人員配置列の予定データが含まれます。 たとえば、今後2週間のスケジュールを生成したとします。 この2週間の予測および人員配置データはイントラデイで見ることができます。
-
過去の1日:テーブルに、その日の全データが表示されます。
再フォーキャスト
再フォーキャストでは、その日の残りの新しい更新されたフォーキャストが提供されます。 再フォーキャストは、最近のフォーキャストとACDからの最近の実際のトレンドに基づいています。 こうすると、日が進み、ACDデータを収集するほど、再予測の精度が高まります。 その日の早い時間に再予測データを見た場合、その値は後で見るほど正確ではないでしょう。 再予測は設定パネルから有効にできます。
その日の再予測データは新しい間隔が始まる15分ごとに更新されます。 終了した間隔は更新されません。
たとえば、15:00、15:15、15:30の再予測列を見るとします。
15:15になると、15:30から終業時刻の16:00まで、データは3つの間隔で更新されます。 その間隔以前のデータは更新されません。
15:30になると、再予測データが再度更新されます。 この時は、15:45と16:00の間隔だけが影響を受けます。
|
インターバル |
15:00の再フォーキャストデータ |
15:15の再フォーキャストデータ |
15:30の再フォーキャストデータ |
|---|---|---|---|
| 14:15 | 90 |
90 |
90 |
| 14:30 | 87 |
87 |
87 |
| 14:45 | 100 |
100 |
100 |
| 15:00 |
96 |
96 |
96 |
|
15:15 |
89 |
89 |
89 |
|
15:30 |
92 |
101 |
101 |
|
15:45 |
93 |
102 |
95 |
|
16:00 |
85 |
96 |
89 |
その間隔のフォーキャスト値が0の場合、再フォーキャストデータは0になります。
つまり、フォーキャストデータが0の時に実際のデータの傾向が増加の場合でも、再フォーキャストは0のままです。
再フォーキャストでは、以下の場合にセルが空白になることがあります。
-
少なくとも4時間はフォーキャストまたはACDデータがありません。 WFMが今後の再フォーキャスト間隔を生成する前に、少なくとも4時間のフォーキャストまたはACDデータが必要です。
たとえば、コンタクトセンターが8時に開く場合、再予測データは12時から利用可能になります。
-
1日の始まりから各間隔のフォーキャストデータまたはACDデータが0の場合。
たとえば、フォーキャスト列を見て、以前のすべての間隔の値が0であることを確認したとします。 この場合、再予測データはありません。
再予測をオンにすると、以下が行われます。
-
各ウィジェットに再予測データの別のグラフが表示されます。
-
Intradayテーブル
 ACDからの着信データに基づいて、その日の残りの時間の新しい予測を作成します。再フォーキャスト機能を有効にする必要があります。に、再フォーキャスト
 再フォーキャストとACDからの実際のトレンドとの差。再フォーキャスト機能を有効にする必要があります。と差異(再フォーキャスト)列が追加されます。
再予測は次の時のみ実行できます:
-
基づいているフォーキャストが存在する時。
再予測データは、Intradayをスキルでフィルタリングした時に更新されます。 再フォーキャストデータがない場合、そのフィルタリングされたスキルのフォーキャストデータが存在しない可能性があります。
-
現在の就業日を見ている。
差異のしきい値
イントラデイテーブルで、差異列を強調表示して差異が大きい箇所や小さい箇所を確認できます。 列のセルは色分けされ、差異が大きいほど濃くなります。 こうすると、注意が必要なメトリックがあるかどうかを確認できます。
イントラデイのウィジェットでは、しきい値がグラフの下にバーで表示されます。
メトリックの差異は、予測と実際の値の差です。 ただし、差異が同じであっても異なる意味を持つ場合があります。 ここでは人員配置の差異について2つのケースを比較することにします。
-
ケースA:
-
フォーキャスト:100
-
実際:130
-
差異:30
-
-
ケースB:
-
予測:1000
-
実際:1030
-
差異:30
-
どちらのケースも差異は30ですが、2番目のケース(+3%)では最初のケース(+30%)ほど大きい差異ではないことがわかります。 これらのケースには、差異のしきい値に基づいて異なる色分けが適用されます。 この場合、差異が同じ値であっても関係ありません。
差異のしきい値を有効にするには:
-
アプリセレクター
 をクリックして、次を選択します:WFM。
 -
[イントラデイ]をクリックします。
-
[オプション]
 をクリックし、[設定]を選択します。
 -
[適用先]で、色分けするメトリックを選択します。
-
各メトリックのスケールには、調整可能な重大度のレベルがあります。 コントロールをスライドさせてしきい値を定義します。
その領域の色が、イントラデイでの色になります。
 例を見る
例を見る
SLAメトリックを次のように定義するとします。

-
濃い赤色:差異が-20%以下のとき、セルはこの色になります。
-
薄い赤色:差異が-20%から-5%のとき、セルはこの色になります。
-
無色:-5%~5%の間。
-
水色:5%~20%の間。
-
濃い青色:20%以上。
-
-
[保存]をクリックします。
イントラデイデータのエクスポート
イントラデイマネジャーテーブルからCSVファイルにデータをエクスポートできます。
エクスポートされたCSVには、時間の値が秒単位で表示されます。
50以上のスキルを選択した場合、エクスポートされたファイルでデータが欠損することがあることにご注意ください。 欠損データを回避するには、データ範囲を低くするか、各エクスポートのデータ範囲を短くして2回エクスポートしてください。 たとえば、14日間にわたって50のスキルをエクスポートする場合を考えてみます。 その場合、7日分ずつ2回エクスポートします。
イントラデイデータをエクスポートするには:
-
ページの右上で、設定
 >エクスポートをクリックします。
 -
エクスポートの日付範囲を定義します。
-
データをエクスポートするスケジューリングユニット, スキル,とメトリックを選択します。
[イントラデイデータのエクスポート]ウィンドウが、イントラデイマネジャーで定義した条件に設定されたフィルタに基づいて開きますが、フィルタは変更できません。
-
エクスポートをクリックします。
IntradayのデータはCSVファイルにエクスポートされてから、コンピューターにダウンロードされます。
Intradayのトラブルシューティング
フォーキャストデータは、スケジュールを生成するために使用したフォーキャストに基づいています。 スケジュールを公開すると、Intradayが新しいフォーキャストデータで更新されます。
スケジュールを公開する前に、どのフォーキャストを選択したかを記憶してください。
スケジュールを公開すると、Intradayが新しいフォーキャストデータで更新されます。 フォーキャストデータは、スケジュールを生成するために使用したフォーキャストに基づいています。
実際列には、その時間間隔にによって![]() エージェントの作業負荷を示す単位。勤務時間内と見なされたエージェントの
エージェントの作業負荷を示す単位。勤務時間内と見なされたエージェントの![]() 対話の終了後にエージェントが作業要件を完了できるようにする状態。フルタイム換算値ACD(FTE)が表示されます。 値は、勤務時間内の個々のエージェント数ではなく、FTEとしてレポートされます。
対話の終了後にエージェントが作業要件を完了できるようにする状態。フルタイム換算値ACD(FTE)が表示されます。 値は、勤務時間内の個々のエージェント数ではなく、FTEとしてレポートされます。
これらは、エージェントがによってオープンACDと見なされる状態です:
-
インタラクションの応答に利用可能。
-
インタラクションの処理。
次に、エージェントが勤務時間内と見なされた時間の合計を15(1間隔の分数)で割ります。 これにより、実際列の値が得られます。
たとえば、アンナ、ケリー、マーティンの3人は11:15から11:30まで勤務する予定だったとします。 その間に、以下を行いました。
-
アンナは、9分間勤務時間内であると見なされました。その間に彼女は4分間通話できる状態で、2分間で1本の通話を処理し、3分間後処理を行いました。 残りの6分間は休憩していました。
-
ケリーは15分間ずっと通話を処理していました。
-
マーティンは6分間、インタラクションを処理できる状態でした。 その後、9分間ミーティングに参加しました。
アンナは9分間、ケリーは15分間、マーティンは6分間、勤務時間内でした。 合わせて、勤務時間内は30分間でした。
3人のエージェントが勤務時間内だった時間(30分)を1間隔の分数(15分)で割ります。
エージェントが勤務時間内だった30分 ÷ 間隔の長さ15分 = 2 FTE
その時間間隔に3人のエージェントが勤務予定だったにもかかわらず、実際値は2になります。
ACDスキルがWEMスキルにマッピングされているかどうかをチェックします。 誰かがマッピングを変更した場合、イントラデイのデータも変更されます。
このソリューションは、想定外のデータが表示された場合や、予期せぬデータの下落があった場合に役立ちます。
空白のセルが表示される場合:
-
実際列:これは、ACDから受信されたデータがなかったことを意味します。 15分を超えて継続する場合は、管理者に連絡してください。
値が0のときは、その間に通話がありませんでした。
-
フォーキャスト列:その日のフォーキャストを実行しなかったか、営業時間外であることを意味します。
-
再フォーキャスト列:以下の場合、再フォーキャストのセルが空白になることがあります。
-
少なくとも4時間はフォーキャストまたはACDデータがありません。 WFMが今後の再フォーキャスト間隔を生成する前に、少なくとも4時間のフォーキャストまたはACDデータが必要です。
たとえば、コンタクトセンターが8時に開く場合、再予測データは12時から利用可能になります。
-
1日の始まりから各間隔のフォーキャストデータまたはACDデータが0の場合。
たとえば、フォーキャスト列を見て、以前のすべての間隔の値が0であることを確認したとします。 この場合、再予測データはありません。
-
それ以外の場合、内部エラーが発生した可能性があります。 再フォーキャストをクリックします。 これで問題が解決しない場合は、管理者に連絡してください。
-
非CXone Mpower ACDを使用する場合、エージェントレベルのデータが受信されないと、人員配置メトリックの実際のデータが正確でなくなる可能性があります。 エージェントレベルのデータを受信していない場合、イントラデイはスキルレベルのデータに従ってデータを表示します。
フォーキャストプロセス間(ステップ3)では、エージェントを考慮せずに、スキルごとのボリュームと平均処理時間(AHT)のみに焦点を当てて、生のフォーキャストを生成します。 (ステップ3)から(ステップ5)まで、シミュレーションプロセスが発生し、予測されたスキルを処理する各スケジューリングユニットにエージェント要件が分配されます。 これらの要件は、スケジューリング単位ごとのスキルごとのボリュームに変換されます。
(ステップ5)では、スクリーンショットに示すように、午前8:00から午前8:15までの間隔のボリュームとAHTを観察でき、シミュレーションの結果としてスキルごとにスケジューリング単位ごとに処理される予定のコンタクト数を示しています。
予測ジョブのステップ 3 からステップ 5 へ、そしてその後 イントラデイ ページへと流れるボリュームは、フォーキャスト ジョブのステップ 5 の合計ボリュームと イントラデイ ページの数値と一致します。
コンタクトセンターに特定のスキルに対応するエージェントが適切に配置されている場合、ASAは通常ゼロになります。 これは、着信したコンタクトが待ち時間なしですぐに応答されることを示します。
コンタクトセンターの人員が過剰であっても、ASA(平均応答速度)はゼロより大きい場合があります。 これは、エージェントがログインしているがコールを受ける準備ができていない場合(たとえば、休憩中、アフターコールワーク(ACW)、または準備ができていない状態にある場合に発生する可能性があります。 実際の順守率が低い場合、スケジュールされたエージェントが十分にいるにもかかわらず、ASA上昇する可能性があります。
また、構成設定も確認してください。 ASAWEMスキルレベルで報告されるため、WEMスキルが関連するACDスキルに正しくマッピングされていることを確認してください。


