

Produits ou fonctionnalités associés : Rapports d'intelligence d'affaires (BI), Quality Management
Autorisations requises : Report Viewer, Informations sur le comportement des agents
Paramètres d'employé requis :Peut afficher les rapports BI
Licence requise :QM Premium, Interaction Analytics
Le rapport Informations sur le comportement des agents affiche des informations sur les tendances comportementales des agents au fil du temps. Il comprend un score résumé au niveau de l'équipe. Vous pouvez afficher les mesures![]() Des statistiques que vous pouvez mesurer pour effectuer le suivi de votre centre de contact. comportementales de l'agent pour chaque interaction .
Des statistiques que vous pouvez mesurer pour effectuer le suivi de votre centre de contact. comportementales de l'agent pour chaque interaction .![]() La conversation complète avec un agent via un canal. Par exemple, une interaction peut être un appel vocal, un e-mail, un chat ou une conversation sur les réseaux sociaux. Ce rapport comprend cinq widgets
La conversation complète avec un agent via un canal. Par exemple, une interaction peut être un appel vocal, un e-mail, un chat ou une conversation sur les réseaux sociaux. Ce rapport comprend cinq widgets![]() Représentation graphique des données qui répondent aux critères de filtre spécifiés. qui vous aident à analyser les performances de votre agent.
Représentation graphique des données qui répondent aux critères de filtre spécifiés. qui vous aident à analyser les performances de votre agent.
Ce rapport donne un aperçu des tendances comportementales au fil du temps, ce qui vous permet d'identifier les scores qui sont souvent élevés ou faibles. Il est important de sélectionner un ou deux indicateurs clés à la fois et d'établir une référence pour déterminer quand un coaching peut être nécessaire. Consultez le rapport à un intervalle défini pour déterminer si les tendances changent ou restent cohérentes.
Ce rapport contient jusqu'à 90 jours de données, à partir de la date d'enregistrement de l'appel.
Ce rapport est un rapport de Business Intelligence (BI) avancé. Les rapports de BI vous permettent d'effectuer des actions telles que le zoom vers des détails ou le regroupement et l'exportation de données.
Les données de ce rapport sont actualisées toutes les heures. La date et l'heure sont affichées en format UTC (fuseau horaire GMT).
Pour accéder à ce rapport et l'exécuter :
-
Sélectionnez le rapport que vous voulez exécuter dans la liste.
-
Remplissez l'invite du rapport. Les étapes et options disponibles varient pour chaque rapport.
-
Cliquez sur Courir.
Notez que vous ne vous pouvez pas utiliser Nouvelle invite afin de modifier les paramètres du rapport. Il n'y a pas d'invite au rapport, car il inclut par défaut des données pour toutes les compétences. Vous pouvez filtrer les données du rapport pour modifier ce qui s'affiche.
Pour la plupart des rapports, vous pouvez filtrer les données du rapport à l'aide de divers paramètres. Vous ne pouvez pas utiliser les filtres pour modifier certains paramètres que vous avez sélectionnés dans l'invite du rapport. Par contre, vous pouvez utiliser Nouvelle invite afin de modifier les paramètres du rapport.
-
Pour modifier les paramètres du rapport, cliquez sur Nouvelle invite
. -
Modifiez les paramètres désirés. Par exemple, si vous voulez modifier la période que vous avez sélectionnée précédemment, réglez Période sur la nouvelle plage souhaitée.
-
Lorsque vous avez terminé de modifier les paramètres du rapport, cliquez sur Exécuter.
Ces filtres s’affichent la première fois que vous exécutez le rapport. Ils s’affichent également lorsque vous cliquez sur Nouvelle invite en haut à gauche du rapport.
-
Période :
Exigences et limites du rapport
Pour afficher et exécuter ce rapport, vous devez avoir les licences QMAdvanced, QMPremiumet Interaction Analytics activées.
Si vous souhaitez que les données d'un agent apparaissent dans ce rapport, les attributs d'employé Peut être évalué/coaché et Peut être analysé doivent être appliqués dans le Admin application. Vous pouvez configurer ceci dans l'onglet Général du profil d'un employé.
Ce rapport analyse et évalue toutes les interactions comportant suffisamment de données, qu'il y ait eu ou non une évaluation. Il ne fournit pas de mesures comportementales pour :
-
Les interactions internes entre agents ou lorsque plusieurs noms d'agents sont présents.
-
Les interactions qui n'ont pas été enregistrées ou qui n'ont pas de son. Cela inclut les interactions qui durent quatre secondes ou moins, qui se terminent avant d'être enregistrées.
-
Les interactions sans dialogue ou avec un son unilatéral. Cela peut se produire en cas de problème technique ou si le client ou l'agent ne répond pas.
-
Les interactions IVR
 Serveur vocal interactif. Menu téléphonique automatisé que les contacts utilisent par entrée vocale ou tactile afin d’obtenir des informations, d’acheminer un appel vocal entrant ou les deux. qui n'impliquent pas d'agents.
 -
Les interactions qui ne sont pas en anglais.
Mode d’utilisation des scores
Les widgets![]() Représentation graphique des données qui répondent aux critères de filtre spécifiés. affichent deux types de scores différents : un pour les interactions
Représentation graphique des données qui répondent aux critères de filtre spécifiés. affichent deux types de scores différents : un pour les interactions![]() La conversation complète avec un agent via un canal. Par exemple, une interaction peut être un appel vocal, un e-mail, un chat ou une conversation sur les réseaux sociaux. individuelles ou un qui regroupe les scores d'interaction d'un agent ou d'une équipe au cours d'une période donnée.
La conversation complète avec un agent via un canal. Par exemple, une interaction peut être un appel vocal, un e-mail, un chat ou une conversation sur les réseaux sociaux. individuelles ou un qui regroupe les scores d'interaction d'un agent ou d'une équipe au cours d'une période donnée.
Scores d’interaction
Chaque interaction se voit attribuer un score d’index brut de 10, 6, 4, 0 ou S.O pour chaque mesure et pour toutes les verticales. La plage de performances est différente pour chaque modèle. La couleur affichée avec la mesure indique le score obtenu par l'interaction dans ce domaine :
-
10 points
 : l'interaction se situe dans les principaux 10 % de toutes les interactions pour le comportement indiqué.
 -
6 points
 : l'interaction se situe entre les principaux 10 % et 35 % de toutes les interactions pour le comportement indiqué.
 -
S/O
 : l'interaction se situe dans la moyenne des 30 % (35-65 %) de toutes les interactions pour le comportement indiqué. Les scores neutres ne sont pas pris en compte dans le score total ou le score total possible.
 -
4 points
 : l'interaction se situe entre les 10 % et 35 % inférieurs de toutes les interactions pour le comportement indiqué.
 -
0 points
 : l'interaction se situe dans les 10 % inférieurs de toutes les interactions pour le comportement indiqué.
Scores agrégés
Les scores agrégés au niveau de l'agent ou de l'équipe sont calculés en utilisant les scores d'index de chaque interaction. Ces scores correspondent à un pourcentage calculé en divisant le total des points reçus par le total des points possibles. Les scores S.O sont exclues du numérateur et du dénominateur de l'équation. La couleur affichée avec la mesure indique le score global de l'agent ou de l'équipe dans ce domaine pour la période spécifiée :
- Fortement positif : 90,5%-100 %
-
Modérément positif
: 70,5 %-90,5 % -
Neutre
: 30,5%-70,5% -
Modérément négatif
: 10,5 %-30,5 % -
Fortement négatif
: 0 %-10,5 %
Le calcul pour six interactions avec des scores de 10, 6, 0, 0, S/O et 6 serait le suivant :
-
10 + 6 + 0 + 0 + S/O + 6 = 22 points obtenus.
-
5 interactions (le score S/O ne compte pas) * 10 points possibles par interaction = 50 points possibles.
-
22 points obtenus / 50 points possibles = 44 %.
Ce score se traduirait par un encadré neutre ou blanc pour ce comportement sur la page de rapport principale.
Widget Mes agents
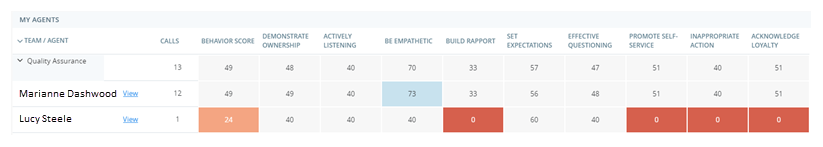
Le widget Mes agents présente des informations sur le comportement des agents et leurs interactions, ainsi qu'un score de synthèse au niveau de l'équipe. Il affiche les suivants détails pour l'équipe sélectionnée :
-
Les interactions globales comptent.
-
Note comportementale moyenne.
-
Métriques de comportement des agents.
Vous pouvez développer la ligne d'une équipe pour voir la répartition des scores de chaque agent. Cette vue fournit des résultats de comportement par appel, avec la possibilité de lire l'interaction directement à partir du rapport. Vous pouvez également voir les scores moyens de l'équipe. Les différentes couleurs représentent les plages de scores moyens :
-
Fortement négatif
: 0 à 10,5 -
Modérément négatif
: 10,5 à 30,5 -
Neutre
: 30,5 à 70,5 -
Modérément positif
: 70,5 à 90,5 -
Fortement positif
: 90,5 à 100
Si la palette de couleurs de la carte thermique est la même dans tout le rapport, elle est utilisée un peu différemment dans les mesures des vues au niveau de l'équipe et au niveau de l'agent. Au niveau de l'agent, les résultats du comportement sont présentés sur une échelle simplifiée à l'aide d'un index et d'icônes. Cela vous permet d'analyser plus facilement les performances de l'agent pour chaque mesure. Par exemple :
-
Un score orange foncé et un visage renfrogné indiquent une faible performance, ce qui signifie que l'agent n'a pas atteint le niveau de performance attendu par le modèle AI.
-
Un score bleu foncé et un visage souriant indiquent une performance élevée, ce qui signifie que l'agent a dépassé le niveau de performance attendu par le modèle AI.
Widget Score de comportement
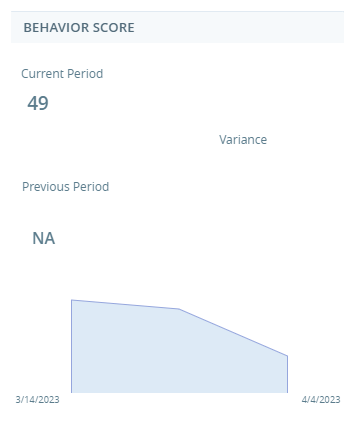
Lorsque vous sélectionnez un agent dans le widget Mes agents, le widget Score de comportement s’affiche. Il présente le score de comportement global de l'agent pour la période sélectionnée. Il affiche également le score de la période précédente. Cela vous permet de savoir si les résultats de l’agent sont à la hausse ou à la baisse au fil du temps. Par exemple, si vous spécifiez la période du 15 au 25 août, le widget affiche le score pour cette période de 10 jours. Il affiche également le score des 10 derniers jours,
La plage temporelle maximale de la période précédente peut varier de 60 à 90 jours. Les rapports de Business Intelligence (BI) comportent en effet des plages de dates standard pour l'extraction des données.
Widget Appels
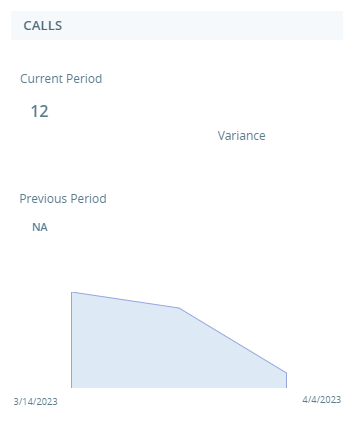
Lorsque vous sélectionnez un agent dans le widget Mes agents, le widget Appels s’affiche. Il indique si les résultats de l'agent sont à la hausse ou à la baisse au cours de la période sélectionnée et des périodes précédentes.
Widget Résumé de l'agent

Lorsque vous sélectionnez un agent dans le widget Mes agents, le widget Résumé de l'agent s’affiche. Il présente le score de l'agent pour chaque mesure de comportement. C'est le score résumé. La légende en haut affiche les différentes couleurs et leurs plages de scores moyens :
-
Fortement négatif
 : 0
: 0 -
Modérément négatif
 : 4
: 4 -
Neutre
 : 5
: 5 -
Modérément positif
 : 6
: 6 -
Fortement positif
 : 10
: 10
Widget d'interactions
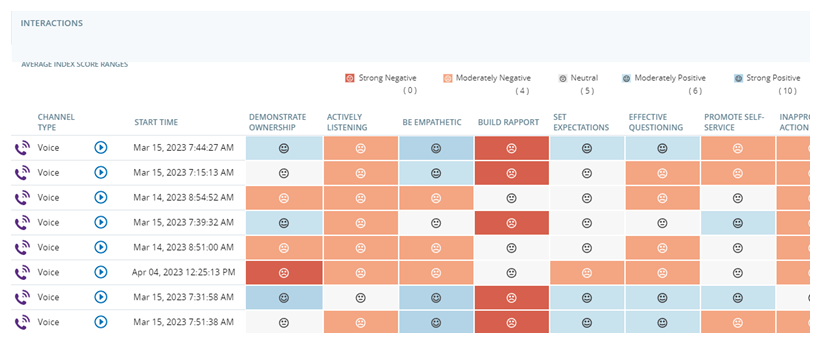
Lorsque vous sélectionnez un agent dans le widget Mes agents, le widget Interactions s’affiche. Il présente des informations sur le comportement des interactions de l'agent au cours de la période sélectionnée. Il inclut le type de canal et l'heure de début de l'interaction. Cliquez sur Jouer pour lire une interaction. La légende en haut affiche les différentes couleurs et leurs plages de scores d’index moyens correspondantes :
-
Fortement négatif
: 0 -
Modérément négatif
: 4 -
Neutre
: 5 -
Modérément positif
: 6 -
Fortement positif
: 10