

Monitor the effectiveness of your Guide proactive offers by setting up a Dashboard that uses one or more of the following Metrics widgets:
-
KPI
-
KPI Trend
-
Metrics Interval
-
Metrics Summary
Configure these widgets to show the Guide-specific metrics to monitor.
To use this feature, you must license Guide with Offers and have the Advanced (paid) conditions permission.
If you licensed Performance Management (Integrated) (Standalone), you can also use that to view Guide metrics.
Configure a Widget to Show Guide Metrics
-
Create a dashboard in Dashboard.
-
Add one or more of the Metrics widgets listed above to the dashboard.
-
Configure each widget to show the desired Guide metrics. You can do this by:
-
Clicking Select Metrics in the middle of the widget.
-
Clicking Options
 in the upper-right corner of the widget, and then clicking Settings
 .
.
The Widget Settings page appears.
-
-
Scroll to the end of the page and click Select Metrics.
-
Click Guide on the left side of the Select Metrics page to display the Guide-specific metrics.
 Learn more about the Guide metrics
metric Details Engagements Shows the total number of engagements for the selected time period. An engagement is counted when a visitor:
-
Starts a chat and an agent accepts the chat.
-
Views a Knowledge Management (Expert) article. If the visitor views the article multiple times, it is still counted as a single engagement.
-
Sends an email.
-
Clicks the link to view a web page in a Link engagement.
-
Clicks the button to start a conversation on WhatsApp,Facebook Messenger, or any other messenger channel.
Conversions
Shows the total number of conversions for a time period. A conversion occurs when a Guide transaction is completed on your website.
A conversion can be a shopping cart purchase or something else, like a completed form for an insurance application. To collect conversion data, you must integrate the
storeConversionAPI on your website.Engaged Conversions Shows the total number of engaged conversions for a time period. An engaged conversion is counted when a Guide proactive offer leads to a conversion.
For example, an engaged conversion is counted in the following scenario:
-
A visitor is shown a proactive offer.
-
The visitor interacts with the offer; for example, the visitor chats with an agent, reads an Knowledge Management (Expert) article, or interacts with a bot.
-
The visitor completes a transaction within 24 hours of being shown the offer.
To collect conversion data, you must integrate the
storeConversionAPI on your website.Conversion Value Shows the total value of the conversions for a time period. A conversion value is attributed to the completion of a successful transaction. The conversion value is logged as part of the storeConversionAPI to track conversions on your website.Avg CNV Value Shows the average value of the conversions for a time period. Engaged CNV Rate Shows the average number of conversions per engagement shown as a percentage for a time period. For example, if you have 10 engagements and 6 conversions, the engaged conversion rate is 60%.
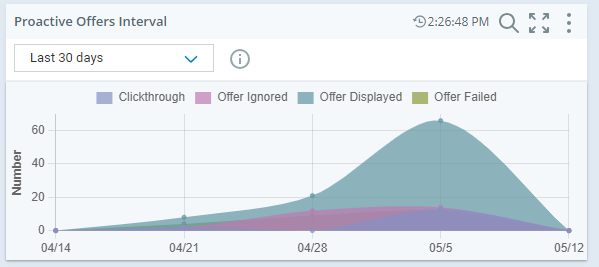
Displayed Offers The number of times a proactive offer appears for a visitor during a visit. An offer can appear multiple times during one visit depending on the conditions set for the offer and the visitor’s behavior on the website. Ignored Offers The number of times a proactive offer is ignored during a visit. An offer is counted as ignored when the offer appears, but the visitor does not click into the offer and does not manually close the offer. Failed Offers The number of times a proactive offer fails during a visit. An offer is counted as failed when the offer appears, and the visitor either closes the offer or Guide removes it due to visitor behavior on the website. Clickthroughs The number of times that a visitor clicks into a proactive offer during a time period. Clickthrough Rate The percentage of time that a visitor clicked into a proactive offer out of the total number of proactive offers displayed during a time period. -
-
Click on the Guide metrics to include in the widget.
Most widgets allow you to select multiple metrics to display.
-
Click Save to save the widget settings.
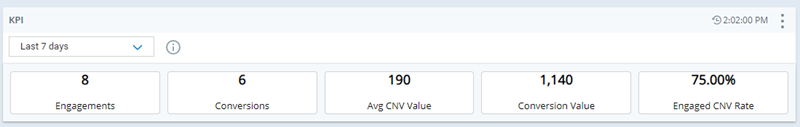
Use the KPI Widget
Use this widget to show summary data of selected key performance indicators that are specific to Guide. For example, you might configure it to show details about engagements and conversions:
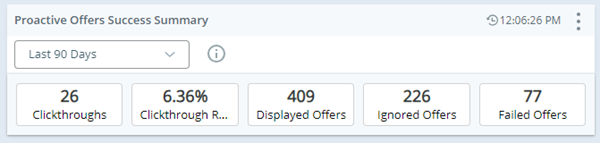
Or, you might want to display details about the success of proactive offers:
You can fine tune the widget display by editing these Settings values:
- Use Display Name to describe the data showcased in the widget. For example, you might use Proactive Offer Success Summary.
- Use Date Range to show results for specific dates, for example, set this to Last 30 days for monthly trends.
-
Use Data Attributes to filter the widget data. Guide attributes include:
-
Device. Use this to limit data by device type. Possible devices are: mobile, desktop, or tablet. If you do not have any engagements of a specific device type, you will not see that option. For example, if you do not have any engagements that occurred on a tablet, you will not see the tablet option.
- Engagement Rule. Use this to limit data to selected engagement rules. Only rules that ran will appear as an option.
-
Engagement Type. Use this to limit data based on how the visitor interacted with the proactive offer. Only engagement types that occurred will appear.
Learn more about possible engagement types
option Details PROACTIVEOFFERENTRYPOINT The visitor clicked an action button that offered an entry point. PROACTIVEOFFERKNOWLEDGEBASE
The visitor clicked an action button that offered an Knowledge Management (Expert) article.
PROACTIVEOFFERCHAT The visitor clicked an action button that started a chat with an agent. PROACTIVEOFFERLINK The visitor clicked an action button that offered a web page (URL link).
-
- Use Select Metrics to set the Guide metrics that appear in the widget.
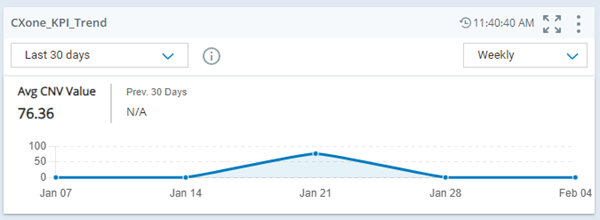
Use the KPI Trend Widget
Use this widget to show the trending of one Guide metric. For example, you can show the trending data for the average conversion value:
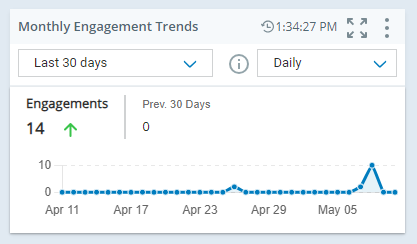
Or, you might want to show trending data for engagements over the past month:
You can fine tune the widget display by editing these Settings values:
- Use Display Name to describe the data showcased in the widget. For example, you might use Monthly Engagement Trends.
- Use Date Range to show results for specific dates, for example, set this to Last 30 days for monthly trends.
- Use Interval Unit to determine how data is rolled up in the report. For example, set to Daily to roll up total engagements per day.
-
Use Data Attributes to filter the widget data. Guide attributes include:
-
Device. Use this to limit data by device type. Possible devices are: mobile, desktop, or tablet. If you do not have any engagements of a specific device type, you will not see that option. For example, if you do not have any engagements that occurred on a tablet, you will not see the tablet option.
- Engagement Rule. Use this to limit data to selected engagement rules. Only rules that ran will appear as an option.
-
Engagement Type. Use this to limit data based on how the visitor interacted with the proactive offer. Only engagement types that occurred will appear.
Learn more about possible engagement types
option Details PROACTIVEOFFERENTRYPOINT The visitor clicked an action button that offered an entry point. PROACTIVEOFFERKNOWLEDGEBASE
The visitor clicked an action button that offered an Knowledge Management (Expert) article.
PROACTIVEOFFERCHAT The visitor clicked an action button that started a chat with an agent. PROACTIVEOFFERLINK The visitor clicked an action button that offered a web page (URL link).
-
- Use Select Metrics to set the Guide metric that appears in the widget.
Use the Metrics Interval Widget
Use this widget to show metrics per the interval you select. For example, the following widget uses a weekly interval:
You can fine tune the widget display by editing these Settings values:
- Use Display Name to describe the data showcased in the widget. For example, you might use Proactive Offers Interval.
-
Use View By to determine how the results appear. Options available for Guide data include:
-
Company (Skill hierarchy) to be able to view all Guide metrics.
-
Engagement Rule to view the results by rule name.
-
Engagement Type to view the results by type of engagement.
-
- Use Date Range to limit the results to specific dates.
- Use Interval Unit to determine how data is rolled up in the report. For example, you may want to look at Daily, Weekly, or Monthly results.
-
Use Data Attributes to filter the widget data. Guide attributes include:
-
CTA name. Use this to limit data by your proactive offer call to action buttons. The Reporting Name specified for each button is used in the reports. Use with the following Guide metrics: Engagements, Clickthroughs, and Clickthrough Rate.
-
Device. Use this to limit data by device type. Possible devices are: mobile, desktop, or tablet. If you do not have any engagements of a specific device type, you will not see that option. For example, if you do not have any engagements that occurred on a tablet, you will not see the tablet option.
- Engagement Rule. Use this to limit data to selected engagement rules. Only rules that ran will appear as an option.
-
Engagement Type. Use this to limit data based on how the visitor interacted with the proactive offer. Only engagement types that occurred will appear.
Learn more about possible engagement types
option Details PROACTIVEOFFERENTRYPOINT The visitor clicked an action button that offered an entry point. PROACTIVEOFFERKNOWLEDGEBASE
The visitor clicked an action button that offered an Knowledge Management (Expert) article.
PROACTIVEOFFERCHAT The visitor clicked an action button that started a chat with an agent. PROACTIVEOFFERLINK The visitor clicked an action button that offered a web page (URL link).
-
- Use Select Metrics to set the Guide metrics that appear in the widget.
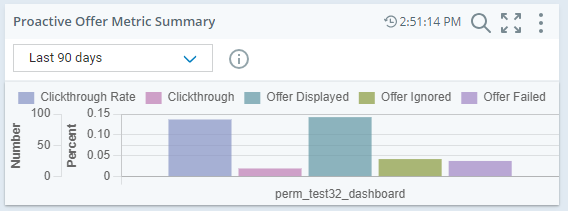
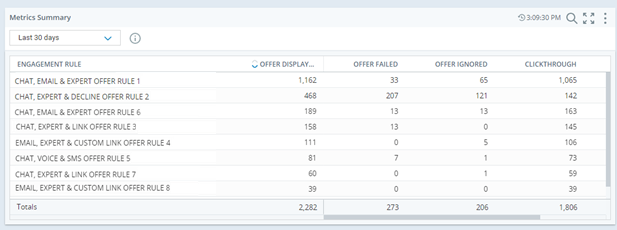
Use the Metrics Summary Widget
Use this widget to show summary data for selected Guide metrics. For example, you can show metrics pertaining to the success rate of your proactive offers:
Or, you can use it to show summary data about engagement rules. For example:
Update the widget settings as needed:
- Use Display Name to describe the data showcased in the widget. For example, you might use Proactive Offer Metric Summary.
-
Use View By to determine how the results appear. Options available for Guide data include:
-
Company (Skill hierarchy) to be able to view all Guide metrics.
-
Engagement Rule to view the results by rule name.
-
Engagement Type to view the results by type of engagement.
-
- Use Date Range to limit the results to specific dates.
-
Use Data Attributes to filter the widget data. Guide attributes include:
-
CTA name. Use this to limit data by your proactive offer call to action buttons. The Reporting Name specified for each button is used in the reports. Use with the following Guide metrics: Engagements, Clickthroughs, and Clickthrough Rate.
-
Device. Use this to limit data by device type. Possible devices are: mobile, desktop, or tablet. If you do not have any engagements of a specific device type, you will not see that option. For example, if you do not have any engagements that occurred on a tablet, you will not see the tablet option.
- Engagement Rule. Use this to limit data to selected engagement rules. Only rules that ran will appear as an option.
-
Engagement Type. Use this to limit data based on how the visitor interacted with the proactive offer. Only engagement types that occurred will appear.
Learn more about possible engagement types
option Details PROACTIVEOFFERENTRYPOINT The visitor clicked an action button that offered an entry point. PROACTIVEOFFERKNOWLEDGEBASE
The visitor clicked an action button that offered an Knowledge Management (Expert) article.
PROACTIVEOFFERCHAT The visitor clicked an action button that started a chat with an agent. PROACTIVEOFFERLINK The visitor clicked an action button that offered a web page (URL link).
-
-
Use Select Metrics to set the Guide metrics that appear in the widget.
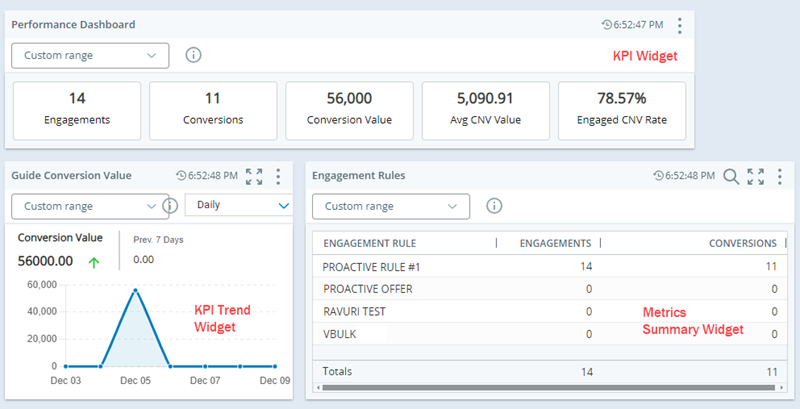
Guide Dashboard Template
The following Guide dashboard can be used as a template to start viewing Guide metrics. The lets you monitor the following:
-
Summary of key performance indicators for Guide.
-
Trends for metrics such as the Conversion Value.
-
Success of engagement rules.
For example:
-
Create a dashboard in Dashboard.
-
Add these Metrics widgets to the dashboard and position as shown above:
-
KPI
-
KPI Trend
-
Metrics Summary
-
-
Edit the KPI widget as follows:
-
Rename the widget using the Display Name field. The default name is KPI. Rename to something useful, such as Performance Dashboard.
-
Set the Date Range for the widget. The default is the current day. Set to a longer period of time so that you can see more data.
-
Click Select Metrics to select the Guide metrics to showcase in the widget, such as Engagements, Conversions, Conversion Value, Avg CVN Value, and Engaged CVN Rate.
-
-
Edit the KPI Trend widget as follows:
-
Rename the widget using the Display Name field. The default name is KPI Trend. Rename to something useful, such as Guide Conversion Value.
-
Set the Date Range for the widget. The default is the current day. Set to a longer period of time so that you can see more data.
-
Change the Interval Unit if needed. By default, it shows data by the hour. You may want to set to a longer period of time such as daily or weekly.
-
Click Select Metric to select the metric to showcase, such as Conversion Value.
-
-
Edit the Metric Summary widget as follows:
-
Rename the widget using the Display Name field. The default name is Metric Summary. Rename to something useful, such as Engagement Rules.
-
Set the Date Range for the widget. The default is the current day. Set to a longer period of time so that you can see more data.
-
Set View By to Engagement Rule. This allows you to see the metric values per engagement rule.
-
Click Select Metrics to select the metrics to display, such as Engagements and Conversions.
-
-
Click Save to save your changes to the dashboard.