

A new plan displays the long term forecast data when creating the plan.
-
the long-term forecast data for a single WEM Skill
-
Click the WEM Skill icon
 and select a WEM Skill from the drop-down list to display plan data for an individual WEM Skill in the plan.
When creating a plan, you select the Scheduling Units for the plan. You can see and change the staffing parameters at the Scheduling Unit level. The Scheduling Unit to WEM Skill staffing distribution updates the WEM Skills associated with the Scheduling Units.

|
Plan Page Item |
Description |
Refer To |
|---|---|---|
| Scheduling Unit Distribution | Add or change the staffing distribution percent for each Scheduling Unit to WEM Skill association in the plan. | Add or Change Scheduling Unit to WEM Skill Staffing Distribution |
|
Options ( |
Export the plan as CSV file, change plan WEM Skill settings, change plan settings. |
|
|
Save As |
Save the plan as a new plan. |
|
|
Save |
Save updates to the plan. |
|
|
WEM Skill Scheduling Unit |
The entity for which you are viewing plan data. |
|
|
Chart ( |
Chart the plan data. |
|
|
Plan data |
Plan parameters in a day, week, or month interval. |
Exporting Plan Data
Click Options ![]() and select Export as CSV to export the plan data you are viewing to a CSV file. The exported data is based on the WEM Skill or Scheduling Unit drop-down selection:
and select Export as CSV to export the plan data you are viewing to a CSV file. The exported data is based on the WEM Skill or Scheduling Unit drop-down selection:
-
one or more Scheduling Units
-
a single WEM Skill
-
All WEM Skills
Click Options ![]() and select Export Every WEM Skill to export the plan data for each WEM Skill in the plan to a CSV file.
and select Export Every WEM Skill to export the plan data for each WEM Skill in the plan to a CSV file.
When the WEM Skill distribution calculation method is Use WEM Skill FTE required and there are unapplied changes in the WEM Skill or All WEM Skills plan details page, the export options are not available. When there are unapplied changes in the Scheduling Unit plan details page, the Export Every WEM Skill option is not available.
The new hire training period does not appear in the exported file.
-
the first row displays the plan name, exported by username, and the export date and time
-
For Export Every WEM Skill, the first row displays only the plan name
-
WEM Skill column with the name of the WEM Skill, if you selected to export every WEM Skill
-
Scheduling Unit column with Plan rollup or name of the Scheduling Units, if you selected to export Scheduling Unit data
-
plan column headings:
-
Parameter
-
the day, week, or month interval heading based on the interval displayed when you exported
-
Total
-
Average
-
-
plan data
Saving a Plan as a New Plan
You must have modify permission to a plan to save it as a new plan.
To save a plan as a new plan:
-
Click Save As on the plan page.
-
In the Save As window, enter the unique Plan Name.
This field allows limited special characters (-, (, ), <, >, #, :, ;, blank). The first and last character cannot be a special character.
-
Click Save.
This saves the plan settings and plan data. The plan data includes All WEM Skills, WEM Skill, Scheduling Unit, and Scheduling Unit to WEM Skill distribution data.
Large plans that take a while to save appear in gray text at the top of the Manage Plans page with PENDING in the Modified Date field. For these plans, refresh the Manage Plans page until the plan is no longer pending.
If the Modified Date of the plan is FAILED, the plan could not be saved. If saving the plan continues to fail, contact your system administrator.
-
Click on the new plan to open it.
WEM Skill or Scheduling Unit View
The WEM Skill view is the default view when opening a plan.
To view or edit plan data for a single WEM Skill or all WEM Skills in the plan, click WEM Skill. The drop-down list contains:
-
All WEM Skills
See plan data totals for all WEM Skills in the plan. This option does not appear for a single WEM Skill plans. This is the default selection.
The WEM Skills are in ascending order.
To view or edit plan data for one or more Scheduling Units in the plan, click Scheduling Unit. The drop-down list contains the plan Scheduling Units.. The Scheduling Units are in ascending order. The default selection is the first Scheduling Unit in the list. Your Scheduling Unit selections for up to the last 10 plans you open will be your new defaults, until you change them or clear your browser's cache.
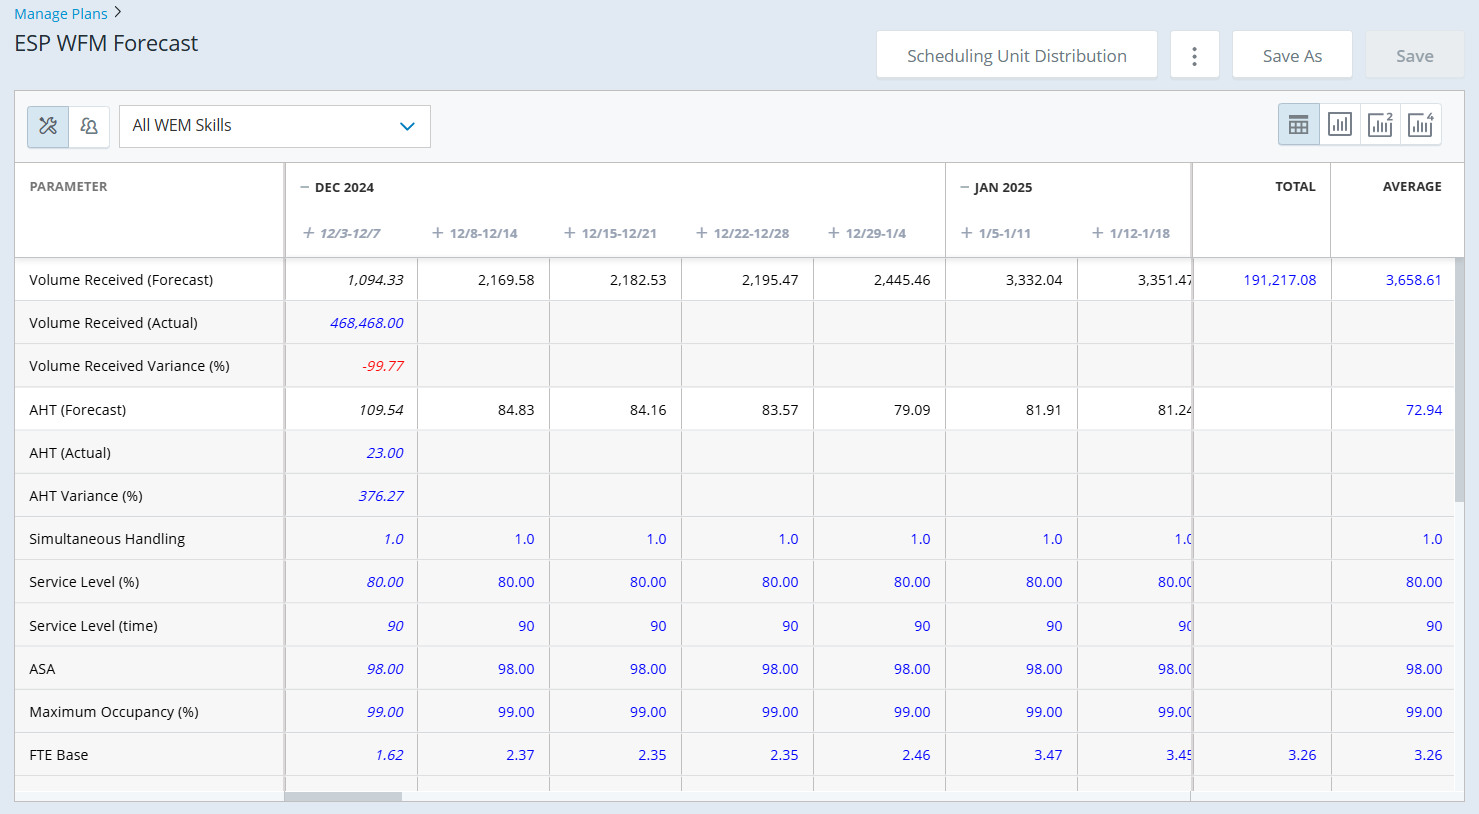
Plan Spreadsheet Rows and Columns
In the plan spreadsheet:
-
Rows with a gray background are read-only.
-
A value in black text is a user-entered value. A value in blue text is a calculated value.
-
When you hover over a parameter name or column header (other than the date header), a tooltip displays the full name.
-
If the plan forecast was an imported forecast, the dates missing from the forecast appear with blank data.
In the Scheduling Unit view:
-
Plan rollup group heading, under the grid column headers, displays the total of these FTE staffing parameters for all Scheduling Units in the plan:
-
FTE Required
-
FTE Actual
-
FTE Required +/-
-
Attrition (%)
-
Attrition (absolute)
-
FTE New Hire
-
-
Under the plan rollup is the data for the selected Scheduling Units. You can collapse or expand this data.
The new hire training period appears next to the Scheduling Unit rollup header as a link. Clicking the link opens the New Hire Training Period window where you can change this value. The link is not available when there are invalid values in the Scheduling Unit view.
 To change the new hire training period for a Scheduling Unit:
-
Click the training period link next to the Scheduling Unit name.
-
Enter the number of weeks it takes to train new agents.
-
Click Submit on the New Hire Training Period window to apply the changes to the Scheduling Unit grid.
-
Click Apply on the Scheduling Unit grid to apply the changes to the WEM Skills.
-
Click Save on the Plan page to save the new value for the plan Scheduling Unit.
.
Changing the new hire training period causes the plan to update the values for FTE Actual. For more information, see Edit Plan Data for FTE actual.
-
|
Parameter |
Appears for This WEM Skill or Scheduling Unit View |
Appears in This Interval? |
|---|---|---|
|
Volume Received (Forecast) |
All WEM Skills, WEM Skill |
Day, Week, Month |
|
Volume Received (Actual) |
All WEM Skills, WEM Skill |
Day, Week, Month |
|
Volume Received Variance (%) |
All WEM Skills, WEM Skill |
Day, Week, Month |
|
Volume Handled* |
All WEM Skills, WEM Skill |
Day, Week, Month |
|
Actual FTE Capacity* |
All WEM Skills, WEM Skill |
Week, Month |
|
Backlog* |
All WEM Skills, WEM Skill |
Week, Month |
|
AHT (Forecast) |
All WEM Skills, WEM Skill |
Day, Week, Month |
|
AHT (Actual) |
All WEM Skills, WEM Skill |
Day, Week, Month |
|
AHT Variance (%) |
All WEM Skills, WEM Skill |
Day, Week, Month |
|
Simultaneous Handling |
All WEM Skills, WEM Skill | Day, Week, Month |
|
Service Level (%) |
All WEM Skills, WEM Skill |
Day, Week, Month |
|
Service Level (time) |
All WEM Skills, WEM Skill |
Day, Week, Month |
|
ASA** |
All WEM Skills, WEM Skill |
Day, Week, Month |
|
Maximum Occupancy (%) |
All WEM Skills, WEM Skill |
Day, Week, Month |
|
FTE Base |
All WEM Skills, WEM Skill |
Day, Week, Month |
|
Multi-skill Efficiency |
All WEM Skills, WEM Skill |
Day, Week, Month |
|
Shrinkage (%) |
All WEM Skills, WEM Skill |
Day, Week, Month |
|
<Shrinkage-ESP attribute values> |
All WEM Skills, WEM Skill |
Day, Week, Month |
|
FTE Required |
All WEM Skills, WEM Skill |
Day, Week, Month |
|
FTE Actual |
All WEM Skills, WEM Skill, Scheduling Unit |
Week, Month |
| Attrition (%) |
All WEM Skills, WEM Skill, Scheduling Unit |
Week, Month |
|
Attrition (absolute) |
All WEM Skills, WEM Skill, Scheduling Unit |
Week, Month |
|
FTE New Hire |
All WEM Skills, WEM Skill, Scheduling Unit |
Week, Month |
|
Projected Service Level (%) |
All WEM Skills, WEM Skill |
Week, Month |
|
Projected ASA** |
All WEM Skills, WEM Skill |
Week, Month |
|
Projected Occupancy (%) |
All WEM Skills, WEM Skill |
Week, Month |
|
FTE Required +/- |
All WEM Skills, WEM Skill |
Week, Month |
|
Hourly Rate |
All WEM Skills, WEM Skill |
Day, Week, Month |
|
FTE Required Cost |
All WEM Skills, WEM Skill |
Day, Week, Month |
|
FTE Actual Cost |
All WEM Skills, WEM Skill |
Week, Month |
|
Cost +/- |
All WEM Skills, WEM Skill |
Week, Month |
|
FTE Required (rollup) |
Scheduling Unit |
Week, Month |
|
FTE Actual (rollup) |
Scheduling Unit |
Week, Month |
|
FTE Required +/- (rollup) |
Scheduling Unit |
Week, Month |
| Attrition (%) (rollup) |
Scheduling Unit |
Week, Month |
| Attrition (absolute) (rollup) |
Scheduling Unit |
Week, Month |
|
FTE New Hire (rollup) |
Scheduling Unit |
Week, Month |
* These parameters appear in the plan for deferrable WEM Skills.
** These parameters do not appear in the plan for deferrable WEM Skills.
For details on editing the parameters you can change, see Edit Plan Data.
The dates included in the plan by month, week, or day. The default is month.
-
If the plan does not include the entire week or month in the first or last interval, the column is in italics (including the week or month heading).
-
For week dates, the plan displays the start date of each week in the plan based on the plan's first day of week.
The total number of forecasted volume received for each day, week, or month in the plan.
-
Original values are from the daily volume received values stored in the plan long-term forecast.
-
Decimal value cut off at 0, 1, or 2 decimal places. Uses the WEM Skill's default decimal format on the plan creation date (defined in the WEM Skills view of the CXone WFM).
The total number of actual volume received for each day, week, or month in the plan.
-
View only. Values come from the Historical Data page.
-
Whole numbers displayed with 0, 1, or 2 decimal places to align with the forecasted volume received. Uses the WEM Skill's default decimal format on the plan creation date (defined in the WEM Skills view of the CXone WFM).
The volume received variance percent for each day, week, or month in the plan.
VolumeReceivedVariance% = (VolumeReceivedForecast - VolumeReceivedActual) / VolumeReceivedActual x 100
-
View only. Percent value cut off at 2 decimal places.
-
Blank interval when Volume Received (Forecast) or Volume Received (Actual) are 0 or blank for the interval.
-
Negative values are in red text, and positive values or zero are in blue text (for calculated values).
|
Volume Received (Forecast) |
Volume Received (Actual) |
|
The total number of volume employees need to handle to meet their service level objectives for each day, week, or month in the plan. The expected volume handled for each day is divided evenly over the service level time. The volume handled for each day is the sum of the volume handled for that day plus the portion of volume handled from previous days.
If the number of open days between the forecast volume received date and the end date of the plan is fewer than the number of days in the service level time, the plan does not account for all the forecast volume received in this column. If the daily service level time is less than 24 hours, ESP uses 1 day. If the daily service level time is greater than 24 hours, ESP uses the full day value. For example, if daily service level time is 2.5 days, ESP uses 2.5.
|
Day |
Sun |
Mon |
Tue |
Wed |
Thu |
Fri |
Sat |
|---|---|---|---|---|---|---|---|
|
Original Forecast Volume Received |
6675 |
0 |
9345 |
7380 |
7160 |
7390 |
7260 |
|
Calculated First Day Volume Handled (using SL %=80) |
1780 |
0 |
3738 |
1686.86 |
2864 |
2956 |
2323.2 |
|
Volume Handled Over SL Time |
|||||||
|
Sun SL Time=3 days |
1780 | 1780 | 1780 | ||||
|
Mon Closed |
|||||||
|
Tue SL Time=2 days |
3738 | 3738 | |||||
|
Wed SL Time=3.5 days |
1686 | 1686 | 1686 | 846 | |||
|
Thu SL Time=2 days |
2864 | 2864 | |||||
|
Fri SL Time=12 hours |
2956 | ||||||
|
Sat SL Time=2.5 days |
2323 | ||||||
|
Total Volume Handled |
1780 |
|
5518 |
7204 |
4550 |
4906 |
2409 |
In the example above, the forecast volume received on Saturday counts as volume handled over 2.5 days (Saturday, Sunday, and Tuesday). But, it does not count the part for Sunday and Tuesday in any volume handled value for the plan. This is because the next open days (Sunday and Tuesday, in this example) fall outside the date range of the plan.
-
View only. Appears for deferrable WEM Skills
-
If Volume Received (Forecast) is 0 or blank for a day, there will be no volume handled based on the forecast volume received for that day (blank). The Volume Handled value for the day is the sum of the volume handled from previous days.
-
If there is no daily service level percent, there are no volume handled based on the forecast volume received for that day (blank). The Volume Handled value for the day is the sum of the volume handled from previous days.
-
If there is a daily service level percent, but no daily service level time, the daily service level time for that day is 1.
-
Decimal value cut off at 0, 1, or 2 decimal places. Uses the WEM Skill's default decimal format on the plan creation date (defined in the WEM Skills view of the CXone WFM).
|
Volume Received (Forecast) |
Service Level (time) |
Service Level (%) |
The number of volume the agents can handle, for each week or month in the plan, based on the number of actual FTE agents and the forecast AHT for each interval. This value also considers occupancy, shrinkage, and multi-skill efficiency, when specified.
If forecast AHT is blank or 0 for the interval, this value is blank. For example, you would change forecast AHT to blank for a holiday.
-
View only. Appears for deferrable WEM Skills.
-
This row does not appear when you display the plan by day.
-
Decimal value cut off at 0, 1, or 2 decimal places. Uses the WEM Skill's default decimal format on the plan creation date (defined in the WEM Skills view of the CXone WFM).
|
AHT (Forecast) |
Mult-skill Efficiency |
Attrition (%) |
|
Simultaneous Handling |
Shrinkage (%) |
Attrition (absolute) |
|
Maximum Occupancy(%) |
FTE Actual |
FTE New Hire |
The number of forecast volume received in previous periods, but not yet handled, for each week or month in the plan.
-
Appears for deferrable WEM Skills.
-
This row does not appear when you display the plan by day.
-
Decimal value cut off at 0, 1, or 2 decimal places. Uses the WEM Skill's default decimal format on the plan creation date (defined in the WEM Skills view of the CXone WFM).
-
Black text for user-entered values, blue text for calculated values.
If the backlog value for the previous interval is blank, the plan uses 0 for this value. If the result of the backlog calculation is a negative value, the plan displays zero for the interval and uses zero to calculate backlog for the next interval.
-
Enter the number of volume in the backlog at the beginning of the plan in the Starting Backlog field. See Plan WEM Skill Settings.
|
Volume Received (Forecast) |
Simultaneous Handling |
Attrition (%) |
|
Volume Handled |
Maximum Occupancy (%) |
Attrition (absolute) |
|
Actual FTE Capacity |
FTE Actual |
FTE New Hire |
| AHT (Forecast) |
|
|
The forecasted average handle time per volume for each day, week, or month in the plan. Forecast AHT is based on the defined time standard or historic volume data, including talk time and after-volume work time.
-
Original values are from the daily AHT values stored in the plan long-term forecast.
-
Value in seconds cut off at 0, 1, or 2 decimal places. Uses the WEM Skill's default decimal format on the plan creation date (defined in the WEM Skills view of the CXone WFM).
The actual average handle time per volume for each day, week, or month in the plan. Actual AHT is based on the historic volume data, including talk time and after-volume work time.
-
View only. Values come from the Historical Data page.
-
Blank interval when Volume Received (Actual) is 0 or blank for the interval.
-
Value in seconds cut off at 0, 1, or 2 decimal places. Uses the WEM Skill's default decimal format on the plan creation date (defined in the WEM Skills view of the CXone WFM).
The average handle time variance percent for each day, week, or month in the plan.
AHTVariance% = (AHTForecast - AHTActual) / AHTActual *100
-
View only. Percent value cut off at 2 decimal places.
-
Blank interval when AHT (Forecast) or AHT (Actual) are 0 or blank for the interval.
-
Negative values are in red text, and positive values or zero are in blue text (for calculated values).
-
For all WEM Skills, the actual AHT uses actual volume received weighting.
-
For deferrable WEM Skills the forecast AHT uses volume handled weighting.
|
AHT (Forecast) |
AHT (Actual) |
|
The average number of interactions, or work items, agents can handle at the same time for the WEM Skill for each day, week, or month in the plan. The week or month weighted averages do not include days with no value (blank days).
-
Defaults to 1.0, if you do not have NICE WFM R7.4 or later.
-
With NICE WFM R7.4 or later, defaults to the WEM Skill’s simultaneous handling when you create the plan. This comes from the Definition tab of the WEM Skills view (in the CXone WFM).
-
Decimal value cut off at 1 decimal place.
The desired percentage of volume handled within the specified service level time (Service Level (time)) for each day, week, or month in the plan. The week or month weighted averages do not include days with no value (blank days).
Your service level goal may be to answer 90% of all volume within 15 seconds.
Service level numbers calculate agent requirements to meet the service level goal.
-
Original values are from the daily service level percent values stored in the plan long-term forecast.
-
Required for deferrable WEM Skills.
-
Percent value cut off at 2 decimal places.
The service level time for each day, week, or month in the plan. Week or month values display only if all open days in the interval have the same value.
Service level numbers calculate agent requirements to meet the service level goal.
-
Original values are from the daily service level time values stored in the plan long-term forecast.
-
Required for deferrable WEM Skills.
-
Integer value in seconds.
The expected average speed of answer for immediate response volume (calls) for each day, week, or month in the plan. The week or month weighted averages do not include days with no value (blank days).
Your ASA goal may be to answer all immediate response volume within 45 seconds.
ASA numbers calculate agent requirements to meet the ASA goal.
-
Original values are from the daily ASA values stored in the plan long-term forecast.
-
This row does not appear for deferrable WEM Skills,.
-
Value in seconds cut off at 2 decimal places.
The average percentage of time you want agents occupied handling volume for each day, week, or month in the plan. The week or month weighted averages do not include days with no value (blank days).
Your maximum occupancy goal could be for agents to spend 85% of their time handling volume.
Maximum occupancy percentages calculate agent requirements to meet the maximum occupancy goal.
-
Original values are from the daily maximum occupancy percent values stored in the plan long-term forecast.
-
Percent value cut off at 2 decimal places.
-
The deferrable WEM Skills require a service level goal.
The total number of forecasted FTE agents required to handle the workload for each day, week, or month in the plan. Agents must meet specified service level, ASA, and maximum occupancy goals.
-
View only. Decimal value cut off at 2 decimal places.
-
Displays ??? when unable to calculate FTE base.
-
All FTE calculations use the daily requirements of the WEM Skills in the plan . FTE calculations also take into account:
-
the WEM Skill simultaneous handling
-
the median patience time, if this value is not blank (see Plan Settings)
The plan calculates FTE values for a deferrable WEM Skill using each of the WEM Skill’s forecast objectives. If any of the forecast objectives are blank for the interval, the plan does not use that objective. If there is no value for forecast AHT, the plan does not calculate FTE values. There are no FTE values for days when the WEM Skill is closed, since the plan cannot distribute data to any hours on these days.
-
|
Volume Received (Forecast) |
Simultaneous Handling |
ASA |
|
Volume Handled |
Service Level (%) |
Maximum Occupancy (%) |
|
AHT (Forecast) |
Service Level (time) |
|
FTE Required |
FTE Required +/- |
FTE Required Cost |
|
Cost +/- |
|
|
The efficiency gained by having agents with multiple skills for each day, week, or month in the plan. The week or month weighted averages do not include days with no value (blank days) or days where the FTE Base is ???.
-
Original values are from the daily multi-skill efficiency values stored in the plan long-term forecast.
-
Displays ??? when unable to calculate multi-skill efficiency.
-
Decimal value cut off at 4 decimal places.
The percentage of time paid agents are unproductive for each day, week, or month in the plan. The week or month weighted averages do not include days with no value (blank days) or days where the FTE Base is ???.
-
Original values are black text from the daily shrinkage percent values stored in the plan long-term forecast.
-
Percent value cut off at 2 decimal places.
-
Displays ??? when unable to calculate shrinkage percent.
-
Black text for edited values, blue text if you edited any of the shrinkage sub-categories.
The Shrinkage-ESP activity code attribute values are sub-categories used to break out the shrinkage percent. Up to 6 of these values appear as rows indented under the Shrinkage (%) parameter. The week or month weighted averages do not include days with no value (blank days) or days where the FTE Base is ???.
Enhanced Strategic Planner uses up to 6 Shrinkage-ESP attribute values. If over 6 values exist, only the first 6 (in alphanumeric order) appear.
-
Original values are blue text, from the even distribution of the Shrinkage (%) value.
-
Percent value cut off at 2 decimal places.
-
Displays ??? when unable to calculate shrinkage sub-categories.
-
Black text if you edit any of the shrinkage sub-categories, blue text if you edited the Shrinkage (%) parameter.
The required number of FTE agents, considering shrinkage and multi-skill efficiency, for each day, week, or month in the plan.
-
View only. Decimal value cut off at 2 decimal places.
-
Displays ??? when unable to calculate FTE required.
|
Volume Received (Forecast) |
Service Level (%) |
FTE Base |
|
Volume Handled |
Service Level (time) |
Multi-skill Efficiency |
|
AHT (Forecast) |
ASA |
Shrinkage (%) |
|
Simultaneous Handling |
Maximum Occupancy (%) |
The number of FTE agents the center will employ during the week or month in the plan.
If you do not have an FTE actual in the first week of the plan, the FTE actual and attrition calculations may not be accurate.
-
This row does not appear when you display the plan by day.
-
Decimal value cut off at 2 decimal places.
-
Values are black text for user-entered values, blue text for calculated values.
-
The plan shows 0 for negative values and uses 0 in other calculations. The FTE actual value comes from the trained new hires and the previous interval’s attrition and FTE actual. The trained new hires are the new hire FTEs that fall in the interval after the new hire training period.
The percentage reduction in actual staff for each week or month in the plan. This row is blank for new plans.
-
View only. This row does not appear when you display the plan by day.
-
Calculated after you enter the Attrition (absolute) for the interval. This value is blank when the FTE actual is blank or 0, or when the absolute attrition is blank.
-
Percent value cut off at 2 decimal places.
-
Maximum displayed value is 100.00.
The absolute reduction in actual staff that takes effect the next interval for each week or month in the plan. This row is blank for new plans.
-
This row does not appear when you display the plan by day.
-
Decimal value cut off at 2 decimal places.
-
Values are black text for user-entered values, blue text for calculated values.
The number of agents the center plans to hire each week or month in the plan. The plan adds the FTE new hires to the FTE actual after taking the new hire training period into account. This row is blank for new plans.
-
This row does not appear when you display the plan by day.
-
Decimal value cut off at 2 decimal places.
-
Values are black text for user-entered values, blue text for calculated values.
The projected service level percent for each week or month in the plan. This is the estimated percentage of volume that will be answered within the service level goal. It is based on FTE actual plus the long-term forecast output of volume received or volume handled, AHT, multi-skill efficiency, and shrinkage. The forecast AHT takes into account the WEM Skill simultaneous handling.
The week or month weighted values do not include days with no value (blank days) for projected service level percent or forecast volume received.
-
View only. This row does not appear when you display the plan by day.
-
Percent value cut off at 2 decimal places.
-
Displays ??? when unable to calculate projected service level percent, or when Volume Received (Forecast), AHT (Forecast), Service Level (time) or FTE Actual is blank for any of the open days in the interval.
For this parameter, if your staffing is very low, ESP cannot calculate a good expectation of service level. Projected Service Level (%) will show ???. This is because ESP does not yet take into account abandons. Specifically, time to abandon, which can create a large variance in service level when staffing is very low.
Projected Service Level (%) changes when the median patience time setting changes.
|
Volume Received (Forecast) |
Simultaneous Handling |
Shrinkage (%) |
|
Volume Handled |
Service Level (time) |
FTE Actual |
|
AHT (Forecast) |
Multi-skill Efficiency |
|
The projected ASA for each week or month in the plan. This is the estimated ASA. It is based on FTE actual plus the long-term forecast output of volume received, AHT, multi-skill efficiency, and shrinkage. The forecast AHT takes into account the WEM Skill simultaneous handling.
The week or month weighted values do not include days with no value (blank days) for projected ASA or forecast volume received.
-
View only. This row does not appear when you display the plan by day.
-
Value in seconds cut off at 2 decimal places.
-
This row does not appear for deferrable WEM Skills.
-
Maximum displayed value is 9999.00. Displays ??? when unable to calculate projected ASA, or when Volume Received (Forecast), AHT (Forecast) or FTE Actual is blank for any of the open days in the interval.
Projected ASA changes when the median patience time setting changes.
|
Volume Received (Forecast) |
Simultaneous Handling |
Shrinkage (%) |
|
Volume Handled |
Multi-skill Efficiency |
FTE Actual |
|
AHT (Forecast) |
|
|
The projected occupancy percent for each week or month in the plan. This is the estimated percentage of time staff will be working volume instead of being idle, waiting for volume to arrive. It is the percentage of volume load versus expected staffing where:
-
volume load includes volume handled or forecast volume handled and AHT. The forecast AHT takes into account the WEM Skill simultaneous handling.
-
expected staffing includes FTE actual. FTE actual accounts for attrition and new hires, multi-skill efficiency, and shrinkage.
The week or month weighted values do not include days with no value (blank days) for projected occupancy percent or FTE actual.
-
View only. This row does not appear when you display the plan by day.
-
Percent value cut off at 2 decimal places.
-
Maximum displayed value is 100.00. Displays ??? when FTE Actual is 0, or when Volume Received (Forecast), AHT (Forecast) or FTE Actual is blank for any of the open days in the interval.
|
Volume Received (Forecast) |
Simultaneous Handling |
Shrinkage (%) |
|
Volume Handled |
Service Level (time) |
FTE Actual |
|
AHT (Forecast) |
Multi-skill Efficiency |
|
The difference between FTE Actual and FTE Required for each week or month in the plan.
-
View only. This row does not appear when you display the plan by day.
-
Decimal value cut off at 2 decimal places.
-
Negative values are in red text, and positive values or zero are in blue text (for calculated values).
-
Blank when FTE Actual or FTE Required is blank. Displays ??? when FTE Required is ???.
|
Volume Received (Forecast) |
ASA |
FTE Required |
|
Volume Handled |
Maximum Occupancy (%) |
FTE Actual |
|
AHT (Forecast) |
FTE Base |
Attrition (%) |
|
Simultaneous Handling |
Multi-skill Efficiency |
Attrition (absolute) |
|
Service Level (%) |
Shrinkage (%) |
FTE New Hire |
| Service Level (time) |
The FTE hourly rate for agents in the plan WEM Skills. Change this field to see the effect on FTE cost for the plan.
-
Original value is from the WEM Skill’s hourly rate, defined in the What-if Parameters tab of the WEM Skills view (in the CXone WFM).
-
Currency value cut off at 2 decimal places. Currency symbol for the initial release is $.
The cost of the FTE requirement for each day, week, or month in the plan.
-
View only. Currency value cut off at 2 decimal places. Currency symbol for the initial release is $.
-
Blank when FTE Required or Hourly Rate is blank. Displays ??? when FTE Required is ???.
|
Volume Received (Forecast) |
Service Level (time) |
Multi-skill Efficiency |
|
Volume Handled |
ASA |
Shrinkage (%) |
|
AHT (Forecast) |
Maximum Occupancy (%) |
FTE Required |
|
Simultaneous Handling |
FTE Base |
Hourly Rate |
|
Service Level (%) |
The cost of the actual FTE for each week or month in the plan.
-
View only. This row does not appear when you display the plan by day.
-
Currency value cut off at 2 decimal places. Currency symbol for the initial release is $.
-
Blank when FTE Actual or Hourly Rate is blank.
|
FTE Actual |
Attrition (absolute) |
Hourly Rate |
|
Attrition (%) |
FTE New Hire |
|
The cost difference for each week or month in the plan.
-
View only. This row does not appear when you display the plan by day.
-
Currency value cut off at 2 decimal places. Currency symbol for the initial release is $.
-
Negative values are in red text, and positive values or zero are in blue text (for calculated values).
-
Blank when FTE Actual Cost or FTE Required Cost is blank. Displays ??? when FTE Required Cost is ???.
|
Volume Received (Forecast) |
Maximum Occupancy (%) |
Attrition (%) |
|
Volume Handled |
FTE Base |
Attrition (absolute) |
|
AHT (Forecast) |
Multi-skill Efficiency |
FTE New Hire |
|
Simultaneous Handling |
Shrinkage (%) |
Hourly Rate |
|
Service Level (%) |
FTE Required |
FTE Required Cost |
|
Service Level (time) |
FTE Actual |
FTE Actual Cost |
|
ASA |
The totals for the rows listed below, using the same format as the values in the row.
|
Volume Received (Forecast) |
FTE Required |
FTE Required +/- |
|
Volume Handled |
FTE Actual |
FTE Required Cost |
|
Actual FTE Capacity |
Attrition (absolute) |
FTE Actual Cost |
|
FTE Base |
FTE New Hire |
Cost +/- |
-
View only.
-
Negative values are in red text, and positive values or zero are in blue text (for calculated values).
-
If all values in a row are blank, the total is blank.
-
The total calculation does not include ??? values.
The average for each row, using the same format as the values in the row . There is no average for Volume Received (Actual), Volume Received Variance (%), AHT (Actual), or AHT Variance (%).
-
View only.
-
Negative values are in red text, and positive values or zero are in blue text (for calculated values).
-
The average calculation for the +/- (OU) parameters uses the sum of the absolute value of the row values. The sign for these averages comes from the sum of the signed values. If this sum is positive, the average is a positive value. If the sum is negative, the average is a negative value.
-
The average calculation does not include partial week or partial month values at the beginning or end of a plan.
-
If all values in a row are blank, the average is blank.
-
The average calculation does not include ??? or blank values.