

-
Open a plan from the Manage Plans page.
-
Click the WEM Skill icon
 and select from the drop-down.
 -
Click the icon for the number of charts you want to see:
-
1-chart view

-
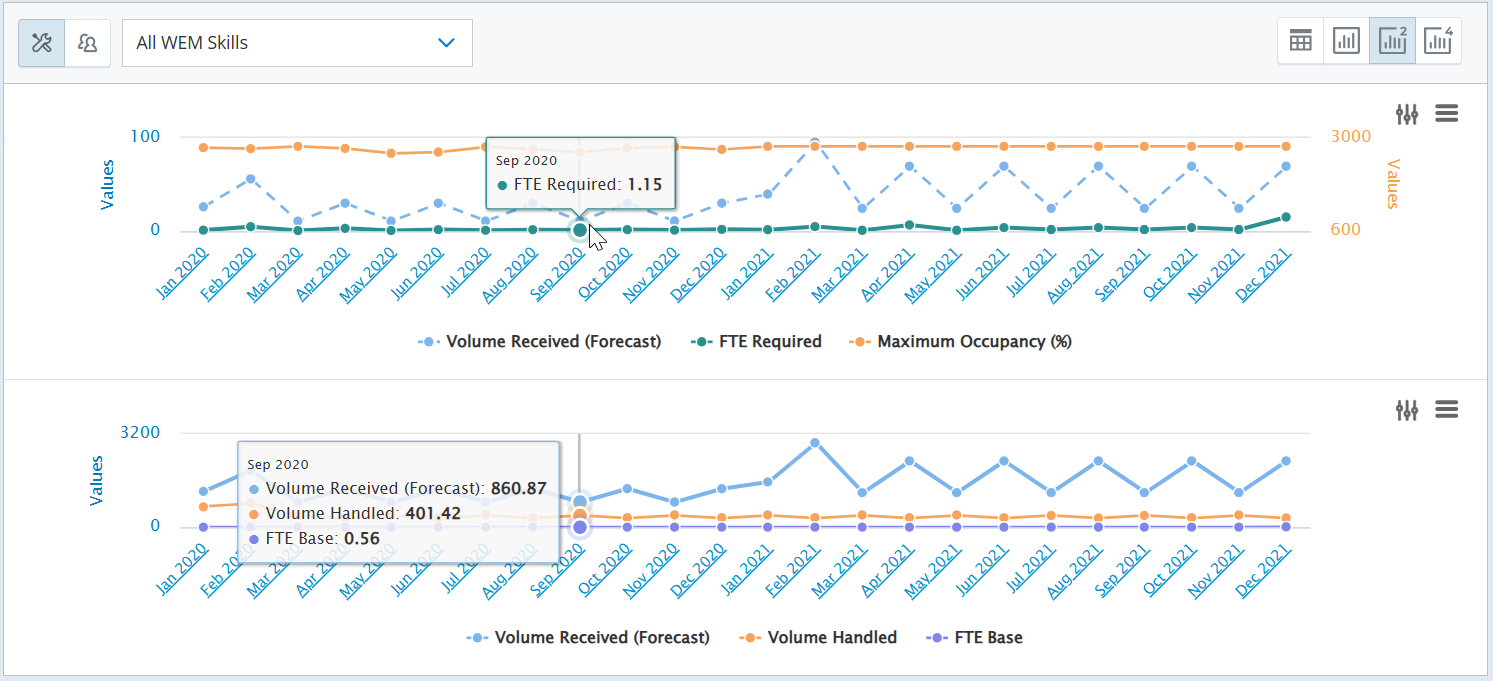
2-chart view

-
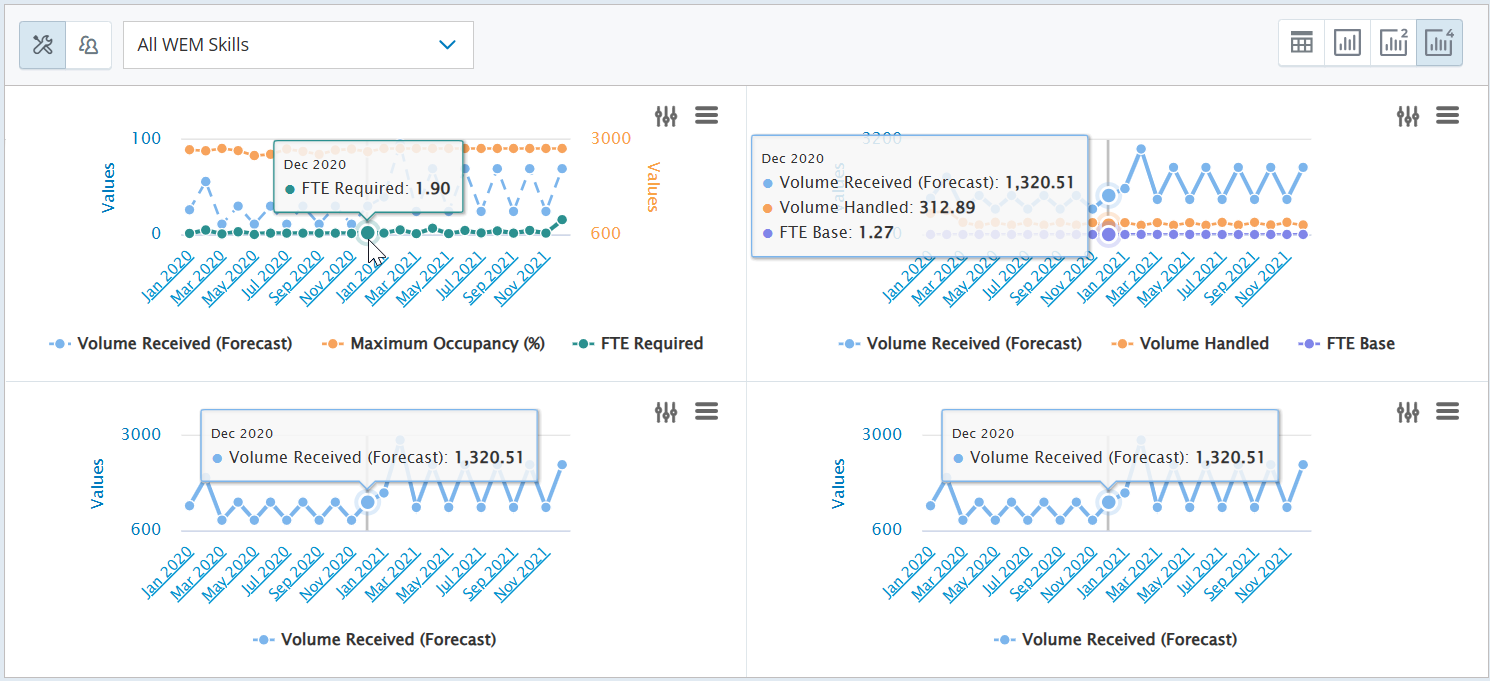
4-chart view

-
-
For each chart, click Show parameters
 and select the Parameters you want to chart.
The default parameter for a WEM Skill or All WEM Skills plan is Volume Received (Forecast).
The list of parameters is based on the interval. See the table under Plan Spreadsheet Rows and Columns.
Your parameter selections will be your new defaults, until you change them or clear your browser's cache.
-
Select to show the parameter on the primary or secondary Y-Axis.
Toggle left for the primary y-axis (blue). Toggle right for the secondary y-axis (orange).
The primary y-axis lines are solid and the secondary y-axis lines are dashed.
-
Click the chart or
 to close the list of parameters.
 -
To see a chart in full screen mode, click Chart menu
 and select View in Full Screen.
Press Esc to exit full screen mode.
-
To change back to the grid view, click Grid view
 .
.
-
Open a plan from the Manage Plans page.
-
Click the Scheduling Unit icon and select one or more Scheduling Units from the drop-down.
-
Click the icon for the number of charts you want to see:
-
1-chart view
-
2-chart view
-
4-chart view
The name of the selected Scheduling Units are displayed below the charts.
-
-
For each chart, click Show parameters
and select the Parameter you want to chart.The default parameter for a Scheduling Unit plan is FTE Actual (rollup).
The list of parameters includes the Plan rollup group parameters and Scheduling Unit group parameters. See the table under Plan Spreadsheet Rows and Columns.
Your parameter selection will be your new default, until you change it or clear your browser's cache.
Each Scheduling Unit has a line for the selected parameter in a different color.
-
Click the chart or
to close the list of parameters. -
To see a chart in full screen mode, click Chart menu
and select View in Full Screen.Press Esc to exit full screen mode.
-
To change back to the grid view, click Grid view
.

View Charts in Month, Week, or Day Interval
When you change to a chart view, the chart shows the interval you were viewing in the grid view (month, week, or day). If you are viewing more than 1 chart, the interval is the same for all charts.
To change the interval:
-
from Month to Week, click a month on the chart x-axis.
-
from Week to Day, click a week on the chart x-axis.
-
from Day to Week, click Weekly View above the first chart y-axis.
-
from Week to Month, click Monthly View above the first chart y-axis.
For the intervals each parameter is available, see the table under Plan Spreadsheet Rows and Columns.
Hide Chart Parameters for WEM Skills
In the Parameters list, you can select or clear the checkbox next to the parameters you want to see or hide in the chart.
To temporarily hide a parameter in a chart:
-
Click the parameter listed below the chart.
The parameter name changes to gray and the line for that parameter goes away.
-
To bring it back, click the parameter below the chart again.
It also comes back when you change the interval or open a different plan.

Hide Chart Scheduling Units
In the Scheduling Unit drop-down, you can select or clear the checkbox next to the Scheduling Units you want to see or hide in the chart.
To temporarily hide a Scheduling Unit in a chart:
-
Click the Scheduling Unit listed below the chart.
The Scheduling Unit name changes to gray and the line for that Scheduling Unit goes away.
-
To bring it back, click the Scheduling Unit below the chart again.
It also comes back when you change the interval or open a different plan.
View or Edit Chart Parameter Values
To see a parameter value on a chart, hover over a point on the chart. The point becomes larger and a tooltip shows the interval, parameter name, and parameter value. If you are viewing more than 1 chart, each chart highlights the same point and a tooltip shows the data for each line. For examples, see the images under Chart Plan Data.
For the daily or weekly interval, you may need to zoom in to see or change the points on a chart. See Zoom In on a Chart Section.
To edit a parameter value on a chart:
-
Drag the point up or down on the chart. The tooltip displays the changing value.
Refer to Edit Plan Data for the parameters you can edit, when you can edit them, and the valid values. You cannot edit the Scheduling Unit plan rollup parameters.
-
If the WEM Skill distribution calculation method is Use WEM Skill FTE required, click Apply after WEM Skill or All WEM Skills updates.
 The Apply button in the WEM Skill or All WEM Skills view:
The Apply button is available when you update a parameter that changes the FTE required value. This button does not appear if the WEM Skill distribution calculation method is Use Scheduling Unit to WEM Skill distribution.
Click Apply to calculate the:
-
Scheduling Unit to WEM Skill distribution for all Scheduling Units and all weeks (see WEM Skill Staffing Distribution)
-
WEM Skill actual staff from the Scheduling Unit FTE actual and the FTE required ratios (Scheduling Unit to WEM Skill distribution above)
You must apply WEM Skill or All WEM Skills updates before you can:
-
save the plan
-
navigate to plan Scheduling Units or the Scheduling Unit to WEM Skill Distribution page
-
export the plan as CSV or export every WEM Skill
-
change the plan settings
-
-
After Scheduling Unit updates, click Apply.
The Apply button in the MU view:You must apply Scheduling Unit updates before you can:
-
save the plan
-
navigate to plan WEM Skills, All WEM Skills, or the Scheduling Unit to WEM Skill Distribution page
-
export every WEM Skill
-
change the plan settings
-
-
To save your changes to the plan, click Save or Save As.
If a parameter has a blank value, it does not appear as a point on the chart. Because of this, you cannot edit chart parameters with a blank value.
You cannot edit the SL (time) parameter when it is blank in the week or month view. This parameter could be blank when the day values are not the same.
Zoom In on a Chart Section
If you are viewing more than 1 chart, the zoom applies only to the chart you select to zoom.
To zoom in on a chart section:
-
Click inside a chart (white area) and drag your cursor right or left to select the area you want to see closer (becomes light blue area).
-
To scroll left or right to see different data (intervals) while zoomed in, hold down the Shift key, then click and drag the cursor
 .
. -
To go back to the original chart, click Reset Zoom or change the interval.

Download or Print Charts
To download a chart, click Chart menu ![]() and select one of these options:
and select one of these options:
-
Download PNG Image
-
Download JPEG Image
-
Download PDF Document
-
Download SVG Vector Image
To print a chart:
-
Click Chart menu
and select Print Chart. -
Select the print settings and click Print.