

This help page is for Desktop Studio. This information is also available for Studio.
可以从
- 检查代码段中的语法。 您可以在编写代码段时随时执行此操作。 它不使用调试器工具。
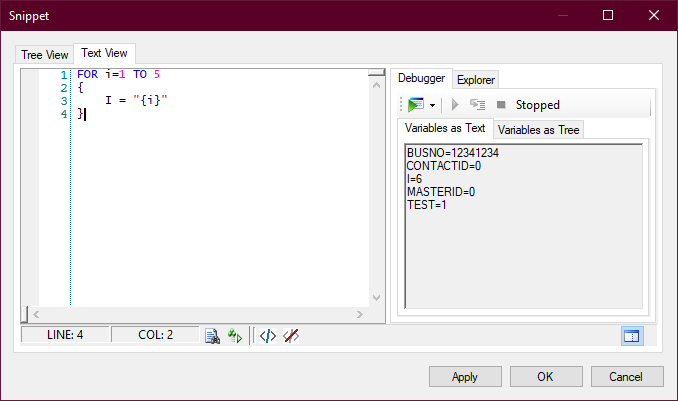
- 调试整个代码段以在执行整个代码段后查看变量及其值。
- 设置断点以在代码中的某一行停止调试。
- 单步执行代码片段中的每一行,并查看变量及其值如何逐行变化。
- 使用 TRACE 语句,将数据输出到
此外,如果代码包含动态对象或数组,您可以查看其内容及其变化方式。
Check Snippet Syntax
您可以让 Studio 检查代码段中的语法。
- 在 Studio 中,打开一个包含 Snippet 操作的脚本。
- 双击 Snippet 操作。
- 如果尚未包含某些代码,请在
-
单击
 。
。如果未发现语法错误,“检查语法”图标旁边的状态字段将显示消息 Okay。
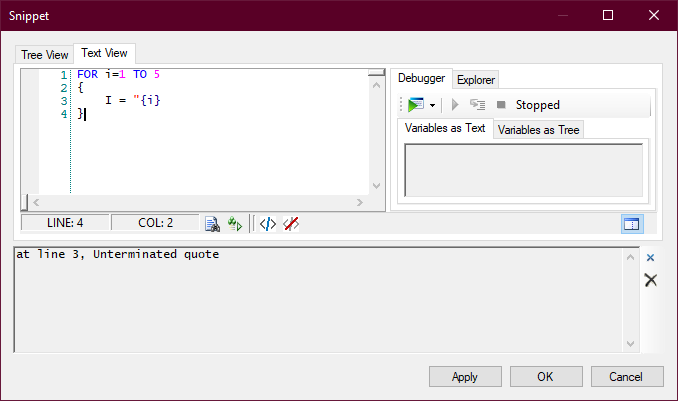
如果发现语法错误,则会弹出一条错误消息来描述该错误。 描述包括错误所在的行号。 此外,“检查语法”图标旁边的状态字段会显示消息 Error at line [#]。
- 纠正发现的任何语法问题。
- 您可以选择代码片段中的一行或多行,然后单击 Comment out selected lines 图标
 。 如果您想跳过某个错误并检查其他错误,这将很有帮助。
 - 您可以在代码片段中选择一个或多个注释行,然后单击 Uncomment the selected lines 图标
 。
。
Use the Debugger Tool
- 在 Studio 中,打开一个包含 Snippet 操作的脚本。
- 双击 Snippet 操作。
- 如果尚未包含某些代码,请在
- 在
- 单击 Debug 图标
 右侧的向下箭头按钮,然后选择 Start
 。
。 -
如果代码中有任何语法错误,
- 纠正错误。
- 纠正错误后,单击 Close 或 Clear Trace Output 图标
 关闭错误窗格。
 - 再次启动调试器。
- 查看
- 您可以选择代码片段中的一行或多行,然后单击 Comment out selected lines 图标。 如果您想删除一些代码以查看调试结果如何变化,这将很有帮助。
- 您可以选择一行或多行注释代码,然后单击 Uncomment the selected lines 图标 将这些行添加回代码段中。
Debug with a Breakpoint
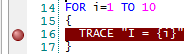
如果希望调试在片段代码的某一行停止,可以设置断点。 这样,您就可以查看代码片段中的部分变量和值,而无需逐行查看。
- 在 Studio 中,打开一个包含 Snippet 操作的脚本。
- 双击 Snippet 操作。
- 如果尚未包含某些代码,请在
-
单击
- 在
- 单击 Debug 图标 右侧的向下箭头按钮,然后选择 Start。
-
如果代码中有任何语法错误,
- 纠正错误。
- 纠正错误后,单击 Close 或 Clear Trace Output 图标关闭错误窗格。
- 再次启动调试器。
- 查看
- 如果断点调试完毕,请再次单击红圈即可清除断点。
- 如果需要的话,设置另一个断点。
- 要从断点继续调试,请单击 Resume 图标
 。
。 - 要停止调试,请单击 Stop Debugging
 图标。
图标。
Step Through Snippet Code
您可以使用调试器工具逐行单步执行代码片段。 这样就可以看到每一行执行时变量及其值的变化情况。
- 在 Studio 中,打开一个包含 Snippet 操作的脚本。
- 双击 Snippet 操作。
- 如果尚未包含某些代码,请在
- 在
- 单击 Debug 图标 右侧的向下箭头按钮,然后选择 Start。
-
如果代码中有任何语法错误,
- 纠正错误。
- 纠正错误后,单击 Close 或 Clear Trace Output 图标关闭错误窗格。
- 再次启动调试器。
- 查看
- 单击 Step 图标
 ,移至代码片段中的下一行。
 - 对代码片段中的每一行重复前两个步骤。
- 如果要跳过剩余的代码行,请单击 Resume 图标。 当片段代码全部执行完毕后,
- 要停止调试,请单击 Stop Debugging 图标,然后从步骤 3 开始重复此过程。
View Contents of Dynamic Objects and Arrays
运行
- 在 Studio 中,双击
- 如果需要,添加片段代码。
- 在
- 在 旁边的向下箭头,然后选择单步执行。 如果不想逐行单步执行代码,请单击开始调试图标。
- 单击单步 图标,观察
- 单步执行所有代码行后,或者单击开始调试时,
-
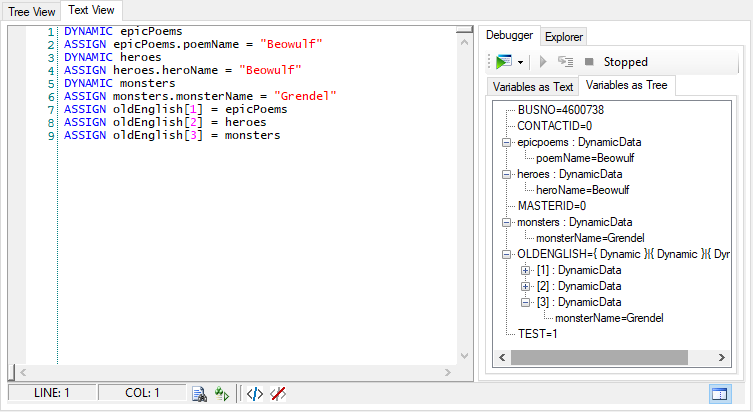
您可以单击代码中任何字符串数组或动态对象旁边的 + 图标将其展开。 如果内容是另一个数组或对象,则可以继续展开树以查看每个实体包含的内容。
使用 TRACE 进行调试
在
语法为:TRACE "<text>"
双引号内的文本将输出到
您可以使用双引号之间的变量替换来打印变量值。 例如:
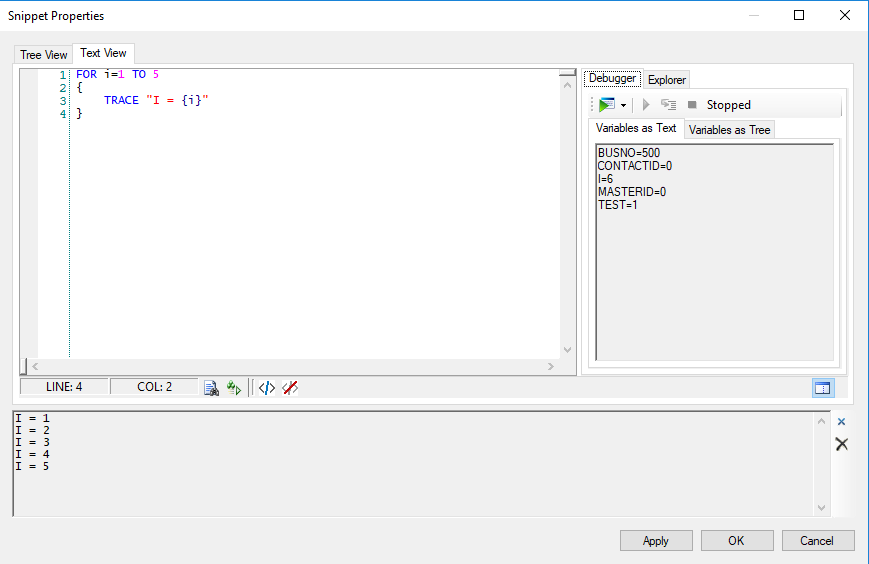
FOR i=1 TO 5
{
   TRACE "I = {i}"
}
此示例的输出为:
I = 1
I = 2
I = 3
I = 4
I = 5
使用测试系统变量
变量是保留用于调试代码片段的系统变量。 它允许您设置代码片段中使用的变量的值,这些变量在脚本命中作之前已经由脚本填充。
在代码片段中使用时,必须将其用作 语句的一部分,并设置为 1。 大括号之间的代码仅在运行代码片段调试器时执行,因为变量在调试器运行时仅等于 1。 当脚本针对联系人![]() 与联络中心的坐席、IVR 或机器人交互的人员。运行时,的值为 0,因此将忽略 语句中大括号之间的代码。
与联络中心的坐席、IVR 或机器人交互的人员。运行时,的值为 0,因此将忽略 语句中大括号之间的代码。
- 在 CXone Mpower 中单击应用程序选择器
 并选择全渠道路由 > Studio
  。
。 - 在“脚本”页面上,找到并双击打开要使用的脚本。 该脚本在新选项卡中打开。
-
打开一个作或将一个新作添加到画布。
-
Click the Text View tab.
-
在窗口的顶部,添加以下代码:
-
代替,插入设置代码段运行所需的初始条件所需的任何代码或语句。
-
添加代码片段所需的任何其他代码。
-
若要测试代码,请单击 bug
 以打开调试器。
 -
单击应用保存代码片段,然后保存脚本。