

This help page is for Desktop Studio. This information is also available for Studio.
Você pode depurar snippets na janela do editor
- Verificar a sintaxe no snippet. Você pode fazer isso a qualquer momento enquanto escreve o código de um snippet. Isso não usa a ferramenta de depuração.
- Depure o snippet inteiro para ver variáveis e seus valores depois que todo o snippet foi executado.
- Defina um ponto de pausa para parar de depurar em determinada linha do código.
- Avance por cada linha no código do snippet e veja como a variável e seus valores mudam linha após linha.
- Use instruções TRACE para gerar dados ao painel
Além disso, se o seu código contém objetos dinâmicos ou matrizes, você pode ver os conteúdos deles e como o código é alterado.
Verificar sintaxe de snippet
Você pode fazer com que Studio verifique a sintaxe em um snippet.
- No Studio, abra um script contendo uma ação Snippet.
- Clique duas vezes na ação Snippet.
- Adicione código Snippet na guia
-
Clique no ícone Check Syntax
 na parte inferior da janela do editor
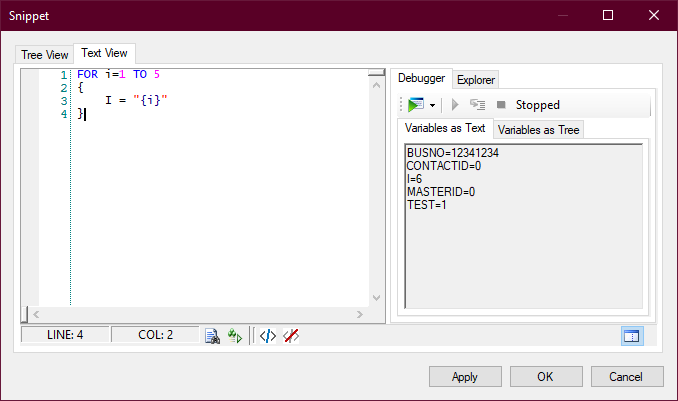
 Se não forem encontrados erros de sintaxe, o campo de status ao lado do ícone Verificar sintaxe exibe a mensagem Okay.
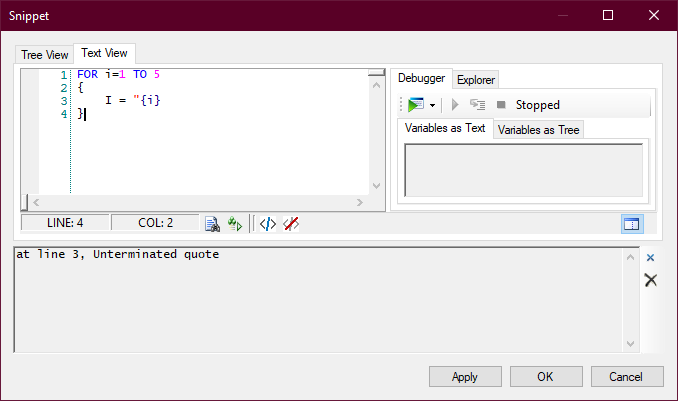
Se forem encontrados erros de sintaxe, uma mensagem de erro aparecerá descrevendo o erro. A descrição inclui o número da linha onde o erro está localizado. Além disso, o campo de status ao lado do ícone Verificar sintaxe exibe a mensagem Error at line [#].
- Corrija erros de sintaxe encontrados.
- Você pode selecionar uma ou mais linhas no código de snippet e clicar no ícone Comment out selected lines
 . Isso é útil se você quer pular um erro e verificar os outros erros restantes.
 - Você pode selecionar uma ou mais linhas comentadas no código de snippet e clicar no ícone Uncomment the selected lines
 .
.
Usar a Ferramenta de depuração
- No Studio, abra um script contendo uma ação Snippet.
- Clique duas vezes na ação Snippet.
- Adicione código Snippet na guia
- No lado direito da janela
- Clique no botão de seta para baixo ao lado direito do ícone Debug
 e selecione Start
 .
. -
Se houver qualquer erro de sintaxe no código, a janela
- Corrija os erros.
- Quando os erros forem corrigidos, clique nos ícones Close ou Clear Trace Output
 para fechar o painel de erros.
 - Inicie o depurador novamente.
- Veja os conteúdos da guia
- Você pode selecionar uma ou mais linhas no código de snippet e clicar no ícone Comment out selected lines . Isso é útil quando você quer remover parte do código para ver como o resultado da depuração muda.
- Você pode selecionar uma ou mais linhas de código comentado e clicar no ícone Uncomment the selected lines para adicionar estas linhas de volta ao snippet.
Depurar com um ponto de pausa
Você pode definir um ponto de pausa se quiser parar de depurar em uma determinada linha do código snippet. Isso permite que você veja as variáveis e valores em partes do snippet sem ter que avançar linha por linha.
- No Studio, abra um script contendo uma ação Snippet.
- Clique duas vezes na ação Snippet.
- Adicione código Snippet na guia
-
Clique na coluna à esquerda dos números de linha na janela
- No lado direito da janela
- Clique no botão de seta para baixo ao lado direito do ícone Debug e selecione Start.
-
Se houver qualquer erro de sintaxe no código, a janela
- Corrija os erros.
- Quando os erros forem corrigidos, clique nos ícones Close ou Clear Trace Output para fechar o painel de erros.
- Inicie o depurador novamente.
- Veja os conteúdos da guia
- Se tiver terminado de usar o ponto de pausa, clique no círculo vermelho de novo para remover o ponto.
- Defina outro ponto de pausa, se precisar de um.
- Para continuar a depuração a partir do ponto de pausa, clique no ícone Resume
 .
. - Para parar a depuração, clique no ícone Stop Debugging
 .
.
Avançar pelo código snippet
Você pode usar a ferramenta de depuração para avançar pelo código snippet linha por linha. Isso permite que você veja como as variáveis e seus valores mudam à medida que cada linha é executada.
- No Studio, abra um script contendo uma ação Snippet.
- Clique duas vezes na ação Snippet.
- Adicione código Snippet na guia
- No lado direito da janela
- Clique no botão de seta para baixo ao lado direito do ícone Debug e selecione Start.
-
Se houver qualquer erro de sintaxe no código, a janela
- Corrija os erros.
- Quando os erros forem corrigidos, clique nos ícones Close ou Clear Trace Output para fechar o painel de erros.
- Inicie o depurador novamente.
- Veja os conteúdos da guia
- Clique no ícone Step
 para avançar para a próxima linha no snippet.
 - Repita as duas etapas anteriores para cada linha no snippet.
- Caso queira pular as linhas restantes do código, clique no ícone Resume . A guia
- Para parar a depuração, clique no ícone Stop Debugging e repita este processo começando pela etapa 3.
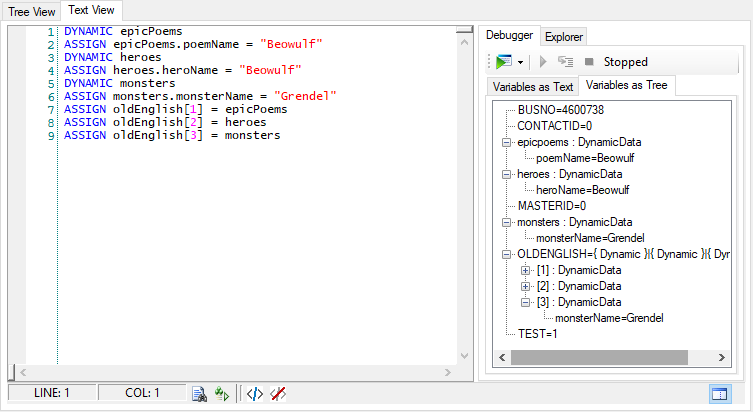
Ver conteúdos de objetos dinâmicos e matrizes
Você pode ver os conteúdos de objetos dinâmicos na janela do editor
- No Studio, clique duas vezes em uma ação
- Adicione o código do snippet, se necessário.
- Na guia
- Na guia selecione Avançar para . Caso não queira avançar pelo código linha por linha, clique no ícone Começar depuração.
- Clique no ícone Avançar e observe os conteúdos na guia
- Quando tiver avançado por todas as linhas de código ou clicado em Começar depuração, a guia
-
Você pode clicar no ícone + ao lado de qualquer conjunto de strings ou objetos dinâmicos no código para expandi-los. Se o conteúdo for outra matriz ou objeto, você poderá continuar a expandir a árvore para ver o que cada entidade contém.
Depurar usando TRACE
A palavra-chave
A palavra-chave
A sintaxe é TRACE "<text>":
Texto dentro de aspas duplas é gerado na janela do editor
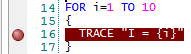
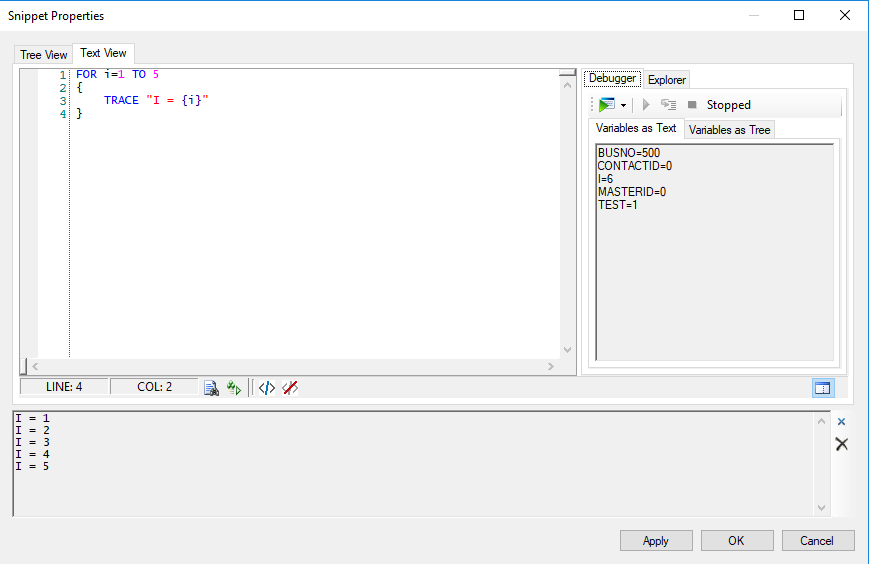
Você pode usar a substituição de variável entre aspas duplas para imprimir o valor de variáveis. Por exemplo:
FOR i=1 TO 5
{
   TRACE "I = {i}"
}
O resultado gerado deste exemplo é:
I = 1
I = 2
I = 3
I = 4
I = 5
Usar a Variável de Sistema de Teste
A variável é uma variável de sistema reservada para uso na depuração de snippets. Ele permite que você defina o valor das variáveis que são usadas no snippet e que já seriam preenchidas pelo script antes que ele atinja a ação .
Quando você usa em um snippet, ele deve ser usado como parte de uma instrução e definido como 1. O código entre as chaves só é executado quando você executa o depurador de snippet porque a variável é igual a 1 quando o depurador é executado. Quando o script é executado para um contato![]() A pessoa que interage com um agente, RVI ou bot em seu centro de contato., tem o valor de 0, portanto, o código entre as chaves na instrução é ignorado.
A pessoa que interage com um agente, RVI ou bot em seu centro de contato., tem o valor de 0, portanto, o código entre as chaves na instrução é ignorado.
- No CXone Mpower, clique no seletor de aplicativos
 e selecioneRoteamento Omnichannel > Studio
  .
. - Na página Scripts, localize e clique duas vezes para abrir o script com o qual deseja trabalhar. O script é aberto em uma nova guia.
-
Abra uma ação ou adicione uma nova à tela.
-
Click the Text View tab.
-
Na parte superior da janela , adicione o seguinte código:
-
No lugar de , insira qualquer código ou instruções necessárias para definir as condições iniciais necessárias para que o snippet seja executado.
-
Adicione qualquer outro código que o snippet requeira.
-
Para testar o código, clique no bug
 para abrir o depurador.
 -
Clique em Aplicar para salvar o snippet e, em seguida, salve seu script.