

이 도움말 페이지는 Studio을(를) 대상으로 합니다. 이 정보는 Desktop Studio에 대해서도 사용할 수 있습니다.
필수 권한: ACD > Studio > 스크립트 >
스크립트의 문제를 확인하려면 스크립트 추적을 실행할 수 있습니다. 이를 통해 스크립트에서 실행되는 동작과 각 동작이 실행되는 시점에 스크립트에 있었던 변수를 확인할 수 있습니다.
각 추적은 별도의 창에서 열립니다. 즉, 이전 추적 기록을 열어 두어 새 추적 기록과 비교하거나 여러 개의 실시간 접촉을 연속으로 캡처할 수 있습니다.
Studio은(는) 수집한 추적 기록을 보관하지 않습니다. 이전 추적을 참조해야 할 수도 있다고 생각되면 추적 출력 창을 열어두거나 컴퓨터에 추적 파일을 다운로드하세요.
단일 스크립트 추적 캡처
스크립트가 저장될 때만 추적을 캡처할 수 있습니다. 저장되지 않은 변경 사항이 있는 상태에서 스크립트 추적 캡처를 시도하면 Studio에서 스크립트를 저장하라고 안내합니다. 스크립트에 컴파일 오류가 있으면 Studio은(는) 스크립트를 저장하지 않습니다. 스크립트를 저장하고 추적을 실행하기 전에 오류를 해결해야 합니다.
- CXone Mpower에서 앱 선택기
 를 클릭하고 선택합니다.옴니채널 라우팅 > Studio
  .
. - 스크립트 페이지에서 작업하려는
- 추적 > 추적 시작을 클릭합니다.
- 수신 전화 ACD 스킬을 선택하세요.
- 매개변수 변수를 통해 스크립트에 값을 전달하려면 매개변수 필드에 값을 입력합니다. 한 줄에 하나의 값을 입력하세요. 입력한 값은 매개변수 P1~Pn에 매핑됩니다. 여기서 n는 마지막으로 추가한 매개변수 값의 번호입니다.
- 수신 전화 스크립트에 대한 상호 작용을 시뮬레이션하려면 인바운드 통화 시뮬레이션을 클릭하고 필요한 정보를 제공합니다.
- 캡처 시작을 클릭합니다다. 추적 출력 창이 열립니다. 스크립트의 첫 번째 동작이 실행될 때까지 창은 비어 있습니다.
- 추적 출력 창의 옵션을 사용하여 추적을 조사합니다.
- 추적 출력을 컴퓨터에 저장하려면:
- 창의 오른쪽 상단에 있는 줄임표
- 를 클릭하고
 추적 파일 다운로드를 선택합니다.
 - 파일의 위치와 이름을 선택하세요.
- 저장을 클릭합니다.
- 를 클릭하고
- 서버에서 인터랙션을 종료하지 않고 추적을 종료하려면 분리를 클릭합니다.
- 추적과 상호 작용을 모두 종료하려면 종료를 클릭한 다음 확인을 클릭하여 확인합니다. 이렇게 하면 서버에서의 인터랙션이 종료되고 연락처 연결이 끊어지거나 현재 스크립트가 종료됩니다.
라이브 연락처에서 추적 추적
라이브 연락처![]() 컨택 센터의 상담원, IVR 또는 Bot과 인터랙션하는 사람입니다.를 처리하는 동안 스크립트가 실행되면서 추적을 캡처할 수 있습니다. 이를 통해 콜센터의 문제를 진단하거나 기술 지원을 위한 데이터를 수집할 수 있습니다.
컨택 센터의 상담원, IVR 또는 Bot과 인터랙션하는 사람입니다.를 처리하는 동안 스크립트가 실행되면서 추적을 캡처할 수 있습니다. 이를 통해 콜센터의 문제를 진단하거나 기술 지원을 위한 데이터를 수집할 수 있습니다.
특정 전화번호를 추적하려면 ANI![]() 발신자 ID라고도 합니다. 수신 음성 통화의 나열된 전화번호입니다. 또는 DNIS
발신자 ID라고도 합니다. 수신 음성 통화의 나열된 전화번호입니다. 또는 DNIS![]() 인바운드 또는 아웃바운드 음성 통화에서 걸려왔거나 걸려 나간 번호.를 입력할 수 있습니다. Studio은 해당 번호와의 접촉만 추적합니다.
인바운드 또는 아웃바운드 음성 통화에서 걸려왔거나 걸려 나간 번호.를 입력할 수 있습니다. Studio은 해당 번호와의 접촉만 추적합니다.
- CXone Mpower에서 앱 선택기 를 클릭하고 선택합니다.옴니채널 라우팅 > Studio .
- 스크립트 페이지에서 작업하려는
-
추적 > 실시간 연락처 캡처를 클릭합니다.
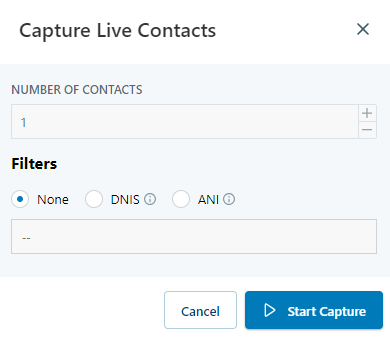
- 추적하려는 연락처 수를 입력하세요.
- 필터에서 옵션을 선택하세요.
- 없음: 이 스크립트가 다음에 실행될 때부터 입력한 연락처 수를 추적합니다.
- DNIS: 이 옵션을 선택하고 DNIS 번호를 입력하세요. Studio는 이 DNIS를 가지고 있는 입력한 연락처의 수를 추적합니다.
- ANI: 이 옵션을 선택하고 ANI 번호를 입력하세요. Studio은 일치하는 ANI가 있는 입력한 연락처 수를 추적합니다.
- 캡처 시작을 클릭합니다다. 추적 출력 창이 열립니다. 선택한 필터 옵션과 일치하는 스크립트 인스턴스가 실행되기 시작할 때까지 창은 비어 있습니다.
- 추적 출력 창의 옵션을 사용하여 추적을 조사합니다.
- 추적 출력을 컴퓨터에 저장하려면:
- 창의 오른쪽 상단에 있는 줄임표
- 를 클릭하고 추적 파일 다운로드를 선택합니다.
- 파일의 위치와 이름을 선택하세요.
- 저장을 클릭합니다.
- 를 클릭하고
- 서버에서 인터랙션을 종료하지 않고 추적을 종료하려면 분리를 클릭합니다.
- 추적과 상호 작용을 모두 종료하려면 종료를 클릭한 다음 확인을 클릭하여 확인합니다. 이렇게 하면 서버에서의 인터랙션이 종료되고 연락처 연결이 끊어지거나 현재 스크립트가 종료됩니다.
여러 라이브 연락처의 추적 캡처
라이브 연락처![]() 컨택 센터의 상담원, IVR 또는 Bot과 인터랙션하는 사람입니다.를 처리하는 동안 스크립트가 실행되면서 추적을 캡처할 수 있습니다. 이를 통해 콜센터의 문제를 진단하거나 기술 지원을 위한 데이터를 수집할 수 있습니다.
컨택 센터의 상담원, IVR 또는 Bot과 인터랙션하는 사람입니다.를 처리하는 동안 스크립트가 실행되면서 추적을 캡처할 수 있습니다. 이를 통해 콜센터의 문제를 진단하거나 기술 지원을 위한 데이터를 수집할 수 있습니다.
최대 20개의 연락처에 대한 추적을 동시에 시작할 수 있습니다. 다중 추적 창이 열리고 스크립트가 라이브 연락처로 실행될 때까지 기다립니다. 연락처를 필터링하기 위해 ANI![]() 발신자 ID라고도 합니다. 수신 음성 통화의 나열된 전화번호입니다. 또는 DNIS
발신자 ID라고도 합니다. 수신 음성 통화의 나열된 전화번호입니다. 또는 DNIS![]() 인바운드 또는 아웃바운드 음성 통화에서 걸려왔거나 걸려 나간 번호.를 지정한 경우 스크립트는 일치하는 번호가 있는 연락처를 기다립니다. 상호 작용
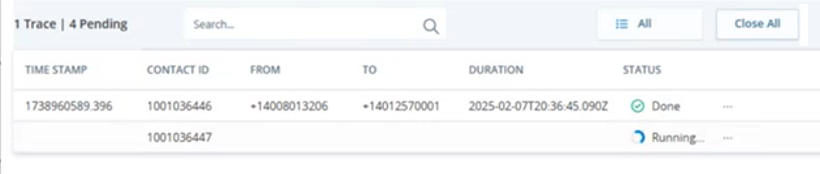
인바운드 또는 아웃바운드 음성 통화에서 걸려왔거나 걸려 나간 번호.를 지정한 경우 스크립트는 일치하는 번호가 있는 연락처를 기다립니다. 상호 작용![]() 채널을 통한 상담원과의 전체 대화입니다. 예를 들어, 인터랙션은 음성 통화, 이메일, 채팅 또는 소셜 미디어 대화가 될 수 있습니다.이 시작되면 각 연락처에 대한 항목이 지정한 개수까지 여러 추적 창에 나타납니다. 창의 왼쪽 상단에 있는 상태는 진행 중이거나 완료된 추적의 수와 연락처가 시작되기를 기다리는 추적의 수를 보여줍니다.
채널을 통한 상담원과의 전체 대화입니다. 예를 들어, 인터랙션은 음성 통화, 이메일, 채팅 또는 소셜 미디어 대화가 될 수 있습니다.이 시작되면 각 연락처에 대한 항목이 지정한 개수까지 여러 추적 창에 나타납니다. 창의 왼쪽 상단에 있는 상태는 진행 중이거나 완료된 추적의 수와 연락처가 시작되기를 기다리는 추적의 수를 보여줍니다.
- CXone Mpower에서 앱 선택기 를 클릭하고 선택합니다.옴니채널 라우팅 > Studio .
- 스크립트 페이지에서 작업하려는
-
추적 > 실시간 연락처 캡처를 클릭합니다.
- 1부터 20까지 추적하려는 연락처 수를 입력합니다.
- 필터에서 옵션을 선택하세요.
- 없음: 이 스크립트가 다음에 실행될 때부터 입력한 연락처 수를 추적합니다.
- DNIS: 이 옵션을 선택하고 DNIS 번호를 입력하세요. Studio는 이 DNIS를 가지고 있는 입력한 연락처의 수를 추적합니다.
- ANI: 이 옵션을 선택하고 ANI 번호를 입력하세요. Studio은 일치하는 ANI가 있는 입력한 연락처 수를 추적합니다.
-
캡처 시작을 클릭합니다다. 다중 추적 창이 열립니다. 스크립트가 연락처에 대해 실행되기 전까지 창은 비어 있습니다. 각 연락처에 대한 정보가 창에 있는 표에 나타납니다. 추적 작업이 끝날 때까지 이 창을 닫지 마세요. 추적 데이터는 자동으로 저장되지 않습니다.
- 보고 싶은 연락처를 찾으려면 다음을 수행합니다.
- 모두 닫기 옆에 있는 버튼을 클릭하고 옵션을 선택하세요. 모두, 완료, 실행 중, 오류 또는 분리됨 중에서 선택할 수 있습니다.
- 검색창을 이용하세요. 상태를 제외한 모든 열을 검색합니다.
-
여러 추적 창에서 연락처 중 하나 옆에 있는 세 개의 점
 을 클릭하고 해당 연락처의 추적에 대한 옵션을 선택합니다.
 이 단계의 필드에 대해 자세히 알아보기
필드 세부 정보 접촉을 끊다 접촉이나 인터랙션을 종료하지 않고 추적을 종료합니다. 연락 종료
추적과 인터랙션이 모두 종료됩니다. 스크립트의 해당 인스턴스는 서버에서 종료되었습니다. 이렇게 하면 인터랙션이 종료되고, 라이브 연락처와 콜센터의 연결이 끊어집니다.
추적 파일 다운로드 JSON 형식으로 추적 파일 사본을 컴퓨터에 다운로드합니다. - 추적 출력을 보려면 연락처를 두 번 클릭하세요.
- 추적 출력 창의 옵션을 사용하여 추적을 조사합니다.
- 여러 추적 창으로 돌아가려면 연락처로 돌아가기를 클릭하세요.
추적 출력 보기
추적을 실행하면 출력이 ![]() 고객 데이터를 수집하거나 음악을 재생하는 것처럼 Studio 스크립트 내에서 프로세스를 수행합니다.을 통해 스크립트가 진행될 때 변수가 변경되는 것을 확인할 수 있습니다.
고객 데이터를 수집하거나 음악을 재생하는 것처럼 Studio 스크립트 내에서 프로세스를 수행합니다.을 통해 스크립트가 진행될 때 변수가 변경되는 것을 확인할 수 있습니다.
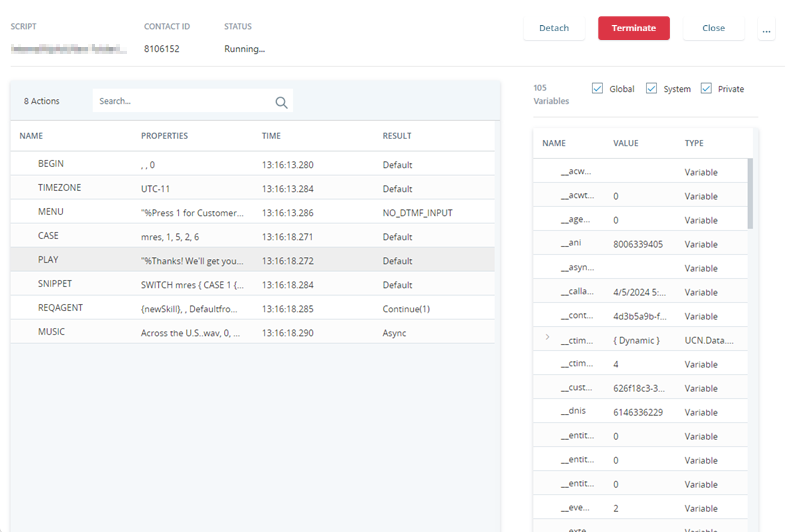
스크립트가 실행되면 동작은 추적 출력 창의 왼쪽에 있는 표에 실행 순서대로 표시됩니다. 액션 이름, 속성 및 구성, 액션이 실행된 시간, 결과를 볼 수 있습니다.
- CXone Mpower에서 앱 선택기 를 클릭하고 선택합니다.옴니채널 라우팅 > Studio .
- 스크립트 페이지에서 작업하려는
-
단일 추적 또는 여러 연락처
컨택 센터의 상담원, IVR 또는 Bot과 인터랙션하는 사람입니다.에 대한 추적을 시작합니다. -
여러 연락처에 대한 추적을 시작한 경우 여러 추적 창에서 연락처를 두 번 클릭하여 추적 출력 창을 엽니다.
- 작업 테이블 위에 있는 검색 창을 사용하여 이름, 속성 이름이나 값, 시간 또는 결과로 작업을 찾으세요.
-
목록을 해당 데이터로 정렬하려면 열 머리글을 클릭하세요.
이 단계의 필드에 대해 자세히 알아보기
필드 세부 정보 이름 스크립트에서 실행된 동작의 이름입니다. 스크립트 이름 동작이 포함된 스크립트의 이름입니다. 이 기능은 라이브 연락처에 대한 추적을 실행할 때 유용합니다. 속성 작업이 실행될 때 작업의 속성과 값입니다. 시간 작업이 시작된 타임스탬프입니다. 결과 발동하는 작업의 결과입니다. 결과는 다음과 같은 메시지일 수 있습니다.
-
Default 또는 Error와 같은 분기가 취해졌습니다.
-
StartAt ONRELEASE은(는) 스크립트가 현재 대기 중이며, 상담원이 상호작용에 답변하면 재시작할 것임을 나타냅니다.
-
Continue (#), 여기서 괄호 안의 숫자는 취해진 분기를 나타냅니다.
-
-
작업의 속성과 값에 대한 자세한 내용을 보려면 속성 열의 항목 위에 마우스를 올려놓으세요.
-
추적 출력 창의 왼쪽에 있는 동작을 두 번 클릭하면 스크립트에서 해당 동작이 어디에 나타나는지 확인할 수 있습니다. 해당 스크립트가 열려 있는 브라우저 탭으로 초점이 이동합니다. 스크립트가 열려 있지 않으면 Studio가 스크립트를 엽니다. Studio은 클릭한 동작에 스크립트를 중앙에 배치합니다.
이 기능은 실행 중이거나 이미 완료된 추적에 적용됩니다. 에 로드된 스크립트 추적 파일에서도 작동합니다.Studio 그러나 스크립트에서 해당 작업이 제거되었거나 스크립트가 시스템 파일에 없는 경우 Studio은 오류를 표시합니다.
이 옵션을 사용하려면 브라우저에서 CXone Mpower URL에 대한 팝업을 활성화해야 할 수도 있습니다.
- 추적 출력에서 작업 행을 클릭하면 작업이 실행된 시점에 스크립트에 있던 모든 변수와 해당 값을 볼 수 있습니다.
변수는 추적 출력 창의 오른쪽 목록에 나타납니다. 새 변수나 변경된 변수는 빨간색 이탤릭체로 표시됩니다. 변수 목록에서 다음을 수행할 수 있습니다.
- 항목 위에 마우스를 올려 놓으면 팝업 창에서 해당 변수 또는 값의 전체 내용을 볼 수 있습니다.
- 검색 창을 사용하여 이름이나 값으로 변수를 찾으세요. 동적 데이터 개체 이름 옆에 있는 보다 큼 기호
- >를 클릭하여 확장하고 해당 멤버와 값을 확인하세요.
- 변수를 두 번 클릭하면 팝업 창에서 해당 값을 볼 수 있습니다.
- 변수 값을 복사하려면 해당 행을 클릭하고 CTRL + C를 누르세요. 복사가 성공적이면 셀 배경이 잠시 진한 파란색으로 바뀝니다.
- 변수 오른쪽에 있는 더하기 기호
 를 클릭하여 변수 감시 목록에 추가합니다. 더하기 기호는 커서를 그 위에 올려놓았을 때만 보입니다.
 - 변수 옆에 있는 체크 표시
 를 클릭하면 변수 감시 목록에서 해당 변수가 제거됩니다.
 - 화살표 키를 사용하여 변수 목록에서 강조 표시된 행을 이동합니다.
열 제목을 클릭하면 해당 데이터별로 변수가 정렬됩니다.
이 단계에서 필드에 대해 자세히 알아보세요.필드 세부정보 이름 변수의 이름입니다. 값 변수가 보유한 값입니다. 유형 변수의 유형입니다. 가능한 유형은 변수, UCN.Data.Dynamic, 동적데이터, UCN.Data.RESTProxy및 모든 .NET 데이터 유형입니다. .NET 데이터 유형에는 String, Int32, Boolean이 있습니다.
추적 파일 다운로드
추적 출력을 컴퓨터에 다운로드할 수 있는 파일로 저장할 수 있습니다. 나중에 추적을 참조해야 할 때 유용합니다. 또한 다른 Studio 사용자나 계정 대표자에 추적 파일을 보낼 수도 있습니다. 해당 파일은 로드하여 Studio에서 볼 수 있습니다. 파일은 TRC.JSON 확장자를 가진 JSON 형식으로 저장됩니다.
- CXone Mpower에서 앱 선택기 를 클릭하고 선택합니다.옴니채널 라우팅 > Studio .
- 스크립트 페이지에서 작업하려는
- 추적을 클릭하고 추적 시작 또는 실시간 연락처 캡처를 선택합니다.
- 추적이 캡처되면 추적 출력 창의 오른쪽 상단 모서리에 있는 줄임표 를 클릭합니다.
- 추적 파일 다운로드를 선택합니다.
- 파일 이름과 파일을 저장할 위치를 지정하세요.
- 저장을 클릭합니다.
추적 파일 로드
저장된 추적 파일을 Studio에 로드하여 볼 수 있습니다. Studio에서 다운로드한 추적 파일만 로드할 수 있습니다. Desktop Studio에서 다운로드한 추적 파일은 해당 애플리케이션에 로드되어야 합니다.
- CXone Mpower에서 앱 선택기 를 클릭하고 선택합니다.옴니채널 라우팅 > Studio .
- 스크립트 페이지에서 로드를 클릭하고 추적 파일 로드를 선택합니다.
- 추적 파일을 로드 추적 창으로 끌거나 파일 찾아보기를 클릭하여 추적 파일을 선택합니다.
- 로드 추적 창에서 열기를 클릭합니다. 추적은 추적 출력 창에서 열립니다.