

This help page is for Studio. This information is also available for Desktop Studio.
Required permissions: ACD > Studio > Scripts >
You can run script traces to check for issues in your scripts. They allow you to see the actions that fire in the script, and the variables that are in the script at the time that each action fires.
Each trace opens in a separate window. This means you can keep previous traces open to compare to the new ones, or capture multiple live contacts in a row.
Studio doesn't keep a history of traces you've captured. If you think you might need to refer to a previous trace, either keep the trace output window open or download the trace file to your computer.
Capture a Single Script Trace
You can track the performance of your script, spawn a script, or make a test call with the
You can only capture a trace if the script is saved. If you attempt to capture a script trace on a script with unsaved changes, Studio prompts you to save the script. If you have compile errors in the script, Studio won't save the script. You must resolve errors before you can save the script and run the trace.
- In NiCE CXone, click the app selector
 and select Omnichannel Routing > Studio
  .
. - On the Scripts page, locate and double-click to open the script you want to work with
- Click Trace > Start with Trace.
- Select an inbound phone ACD Skill.
- To pass values into the script via parameter variables, enter the values in the Parameters field. Enter one value per line. The values you enter map to parameters P1 through Pn, where n is the number of the last parameter value you add.
- To simulate an interaction for an inbound phone script, click Simulate Inbound Call and provide the necessary information.
- Click Start Capture. The trace output window opens. The window stays empty until the first action in the script fires.
- Use the options on the trace output window to examine the trace.
- To save the trace output to your computer:
- Click the ellipsis
 in the top right corner of the window and select Download the trace file.
 - Choose a location and name for the file.
- Click Save.
- Click the ellipsis
- To end the trace without ending the interaction on the server, click Detach.
- To end both the trace and the interaction, click Terminate, then click OK to confirm. This ends the interaction on the server and disconnects the contact or ends the current script.
Capture Traces on Live Contacts
You can capture a trace on a script as it runs while processing live contacts![]() The person interacting with an agent, IVR, or bot in your contact center.. This allows you to diagnose issues in your contact center or gather data for technical support.
The person interacting with an agent, IVR, or bot in your contact center.. This allows you to diagnose issues in your contact center or gather data for technical support.
If you want to trace a specific phone number, you can enter an ANI![]() Also known as caller ID. Listed phone number of an incoming voice call. or DNIS
Also known as caller ID. Listed phone number of an incoming voice call. or DNIS![]() The number dialed on inbound or outbound voice calls.. Studio only traces contacts with that number.
The number dialed on inbound or outbound voice calls.. Studio only traces contacts with that number.
- In NiCE CXone, click the app selector and select Omnichannel Routing > Studio .
- On the Scripts page, locate and double-click to open the script you want to work with
-
Click Trace > Capture Live Contacts.
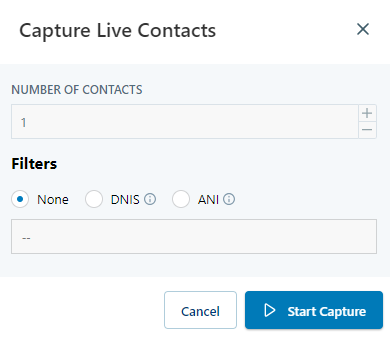
- Enter the Number of Contacts you want to trace.
- Under Filters, select an option:
- None: Traces the number of contacts you entered, starting the next time this script runs.
- DNIS: Select this option and enter a DNIS number. Studio traces the number of contacts you entered that have this DNIS.
- ANI: Select this option and enter an ANI number. Studio traces the number of contacts you entered that have a matching ANI.
- Click Start Capture. The trace output window opens. The window stays empty until an instance of the script matching the selected Filter option begins to run.
- Use the options on the trace output window to examine the trace.
- To save the trace output to your computer:
- Click the ellipsis in the top right corner of the window and select Download the trace file.
- Choose a location and name for the file.
- Click Save.
- Click the ellipsis
- To end the trace without ending the interaction on the server, click Detach.
- To end both the trace and the interaction, click Terminate, then click OK to confirm. This ends the interaction on the server and disconnects the contact or ends the current script.
Capture Traces on Multiple Live Contacts
You can capture traces on a script as it runs while processing live contacts![]() The person interacting with an agent, IVR, or bot in your contact center.. This allows you to diagnose issues in your contact center or gather data for technical support.
The person interacting with an agent, IVR, or bot in your contact center.. This allows you to diagnose issues in your contact center or gather data for technical support.
You can start traces for up to 20 contacts at once. The multiple traces window opens and waits for the script to run with live contacts. If you've specified an ANI![]() Also known as caller ID. Listed phone number of an incoming voice call. or DNIS
Also known as caller ID. Listed phone number of an incoming voice call. or DNIS![]() The number dialed on inbound or outbound voice calls. to filter contacts, the script waits for contacts with a matching number. As interactions
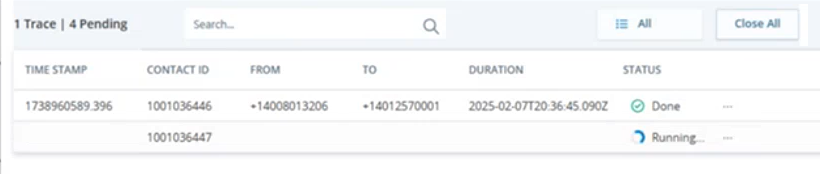
The number dialed on inbound or outbound voice calls. to filter contacts, the script waits for contacts with a matching number. As interactions![]() The full conversation with an agent through a channel. For example, an interaction can be a voice call, email, chat, or social media conversation. begin, entries for each contact appear in the multiple traces window, up to the number you specified. The status in the upper left corner of the window shows how many traces are in progress or complete, and how many are still waiting for contacts to start.
The full conversation with an agent through a channel. For example, an interaction can be a voice call, email, chat, or social media conversation. begin, entries for each contact appear in the multiple traces window, up to the number you specified. The status in the upper left corner of the window shows how many traces are in progress or complete, and how many are still waiting for contacts to start.
- In NiCE CXone, click the app selector and select Omnichannel Routing > Studio .
- On the Scripts page, locate and double-click to open the script you want to work with
-
Click Trace > Capture Live Contacts.
- Enter the Number of Contacts you want to trace, from 1 to 20.
- Under Filters, select an option:
- None: Traces the number of contacts you entered, starting the next time this script runs.
- DNIS: Select this option and enter a DNIS number. Studio traces the number of contacts you entered that have this DNIS.
- ANI: Select this option and enter an ANI number. Studio traces the number of contacts you entered that have a matching ANI.
-
Click Start Capture. The multiple traces window opens. The window is empty until the script begins to run for a contact. Information about each contact appears in the table on the window. Do not close this window until you're finished working with the traces. The trace data is not saved automatically.
- To filter contacts to locate the one you want to view:
- Click the button next to Close All and select an option. You can choose from All, Done, Running, Error, or Detached.
- Use the search bar. It searches all columns except Status.
-
On the multiple traces window, click the three dots
 next to one of the contacts and choose an option for that contact's trace.
 Learn more about fields in this step
Field Details Detach from contact Ends the trace without ending the contact or interaction. Terminate contact
Ends both the trace and the interaction. That instance of the script is ended on the server. This ends the interaction, which will disconnect the live contact from your contact center.
Download trace file Download a copy of the trace file to your computer in JSON format. - Double-click a contact to view its trace output.
- Use the options on the trace output window to examine the trace.
- Click Back to Contacts to return to the multiple traces window.
View Trace Output
When you run a trace, the output appears in the ![]() Performs a process within a Studio script, such as collecting customer data or playing music..
Performs a process within a Studio script, such as collecting customer data or playing music..
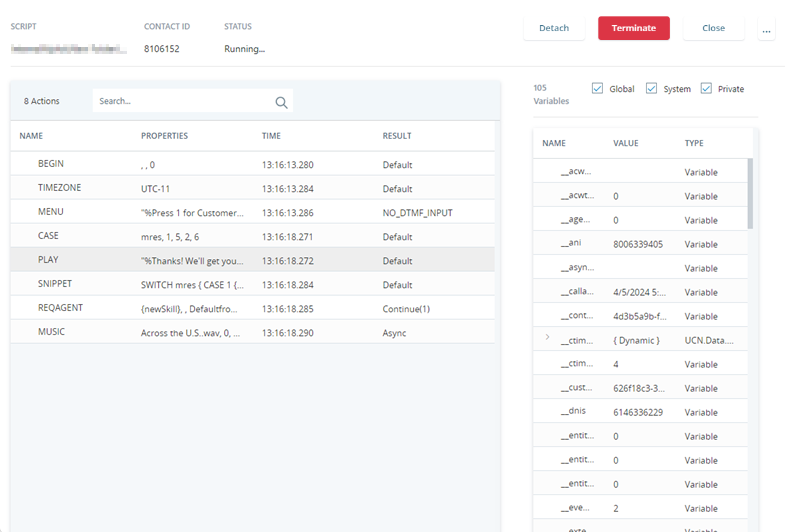
As the script runs, actions show up in the table on the left side of the trace output window in the order they fire. You can see the action name, its properties and their configurations, the time the action fired, and the result.
- In NiCE CXone, click the app selector and select Omnichannel Routing > Studio .
- On the Scripts page, locate and double-click to open the script you want to work with
-
Start a single trace or a trace on multiple contacts
The person interacting with an agent, IVR, or bot in your contact center.. -
If you started a trace on multiple contacts, double-click a contact on the multiple traces window to open the trace output window.
- Use the search bar above the actions table to find actions by name, property name or value, time, or result.
-
Click any column heading to sort the list by that data.
Learn more about fields in this step
Field Details Name The name of the action in the script that fired. Script Name The name of the script the action is in. This is helpful when running a trace on live contacts. Properties The action's properties and their values when the action fired. Time The timestamp of when the action fired. Result The outcome of the action firing. The result may be messages such as:
-
The branch that was taken, such as Default or Error.
-
StartAt ONRELEASE indicates that the script is currently waiting and will restart when an agent answers the interaction.
-
Continue (#), where the number in parentheses indicates the branch that was taken.
-
-
To see more information about an action's properties and their values, hover over an entry in the Properties column.
-
Double-click an action on the left side of the trace output window to see where that action appears in the script. The focus shifts to the browser tab where the appropriate script is open. If the script isn't open, Studio opens it. Studio centers the script on the action you clicked.
This works on traces that are running or have already completed. It also works on script trace files that were loaded into Studio. However, if the action has been removed from the script or the script does not exist in your system's files, Studio displays an error.
To use this option, you may need to enable popups in your browser for the NiCE CXone URL.
- Click an action's row in the trace output to see all variables and their values in the script at the time that the action fired.
The variables appear in the list on the right side of the trace output window. New or changed variables are shown in red italics. In the variables list, you can:
- Hover over entries to view the full contents of that variable or value in a pop-up window.
Select or clear Global, System, or Private to filter the variables in the list.
Learn more about fields in this stepField Details Global Global variables can be passed from subscripts back to the calling script. System
System variables are predefined and added to scripts automatically as a script runs.
Private Private variables are only available to be used by the script within the action where they originate.
- Use the search bar to find variables by name or value.
- Click the greater-than symbol > next to the name of a dynamic data object to expand it and see its members and their values.
- Double-click a variable to view its value in a pop-up window.
- Copy a variable value by clicking its row and pressing CTRL + C. The cell background briefly turns dark blue to show that the copy was successful.
- Click the plus sign
 to the right of a variable to add it to the variable watchlist. The plus sign is only visible when the cursor hovers over it.
 - Click the checkmark
 next to a variable to remove it from the variable watchlist.
 - Use the arrow keys to move through the highlighted row in the variables list.
Click a column heading to sort the variables by that data.
Learn more about fields in this stepField Details Name The name of the variable. Value The value the variable holds. Type The type of variable. Possible types are Variable, UCN.Data.Dynamic, DynamicData, UCN.Data.RESTProxy, as well as any .NET data type. .NET data types include String, Int32, and Boolean.
Download Trace Files
You can save the trace output as a file that you can download to your computer. This is helpful if you need to refer to a trace later. It also allows you to send a trace file to other Studio users or to your account representative. The files can be viewed by loading them in Studio. Files are saved in JSON format with a TRC.JSON extension.
- In NiCE CXone, click the app selector and select Omnichannel Routing > Studio .
- On the Scripts page, locate and double-click to open the script you want to work with
- Click Trace and select Start with Trace or Capture Live Contacts.
- When the trace is captured, click the ellipsis in the upper right corner of the trace output window.
- Select Download the trace file.
- Specify a File name and where you want to save the file.
- Click Save.
Load Trace Files
You can load a saved trace file into Studio to view it. You can only load trace files downloaded from Studio. Trace files downloaded from Desktop Studio must be loaded into that application.
- In NiCE CXone, click the app selector and select Omnichannel Routing > Studio .
- On the Scripts page, click Load and select Load trace file.
- Drag a trace file onto the Load Trace window or click browse for files to select one.
- Click Open on the Load Trace window. The trace opens in a trace output window.