
Esta página de ayuda es para Studio. Esta información también está disponible para Desktop Studio.
Puede depurar los snippets desde la ventana del editor
- Depurar todo el snippet para ver las variables y sus valores después de que se haya ejecutado todo el snippet.
- Establecer un punto de interrupción para detener la depuración en una línea determinada del código.
- Ingresar a cada línea en el código del snippet y ver cómo cambia la variable y sus valores línea por línea.
- Utilice instrucciones TRACE para enviar datos al
Además, si su código contiene matrices u objetos dinámicos, puede ver su contenido y como cambia.
Si tiene DLL SOAP personalizadas en su unidad de negocio Agrupación organizativa de alto nivel utilizada para administrar el soporte técnico, la facturación y la configuración global de su sistema NiCE CXone., no se incluyen al depurar fragmentos.
Utilice la Herramienta de depuración
- En Studio, abra un script que contenga una acción Snippet.
- Haga clic en Abrir editor
 en la acción Snippet.
- Add Snippet code, if it doesn't already contain some.
- On the left side of the Snippet editor window, click the bug
 . The Run & Debug panel slides out from the left side of the window.
- Click the triangle
 to start debugging.
-
View the contents of the Variables section of the Run & Debug panel.
-
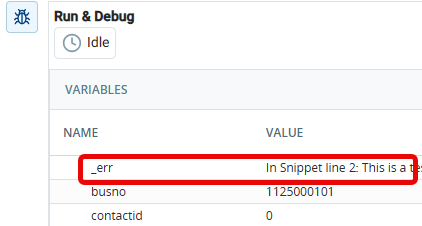
Check for errors in the _err variable at any point in the debugging process. Some errors pop up as toast
mensajes emergentes pequeños y temporales en la parte inferior de la pantalla que indican cosas como errores y éxitos. messages in the - To make changes to your snippet:
- Stop the debugger, if it's running. While the debugger is running, the snippet is in read-only mode.
- Make your changes.
- Click Apply in the
- Reopen the
Depurar con un punto de interrupción
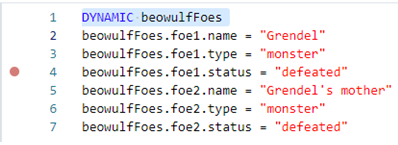
Puede definir un punto de interrupción si desea que se detenga la depuración en una línea específica del código del snippet. Puede establecer más de un punto de interrupción y hacer que el depurador salte de un punto de interrupción a otro. Esto le permite ver las variables y los valores en puntos específicos del fragmento sin tener que recorrerlo línea por línea.
Puede establecer puntos de interrupción antes de iniciar el depurador o mientras se está ejecutando. La depuración se detiene cuando la línea con el punto de interrupción está a punto de ejecutarse. Mientras está en pausa, puede ver el valor actual de todas las variables en el fragmento en la sección Variables de la ventana Ejecutar y depurar.
- En Studio, abra un script que contenga una acción Snippet.
- Haga clic en Abrir editor en la acción Snippet.
- Add Snippet code, if it doesn't already contain some.
- On the left side of the Snippet editor window, click the bug . The Run & Debug panel slides out from the left side of the window.
-
Add a breakpoint by clicking in the column to the left of any line in the Snippet editor window. A red dot appears next to the line number. You can add more than one breakpoint to the snippet. You can also add breakpoints while the debugger is running.
- Click the triangle to start debugging.
-
View the contents of the Variables section of the Run & Debug panel.
 appears in the breakpoint column.
- If you're done with a breakpoint, click the red circle again to clear it.
- To continue debugging from the breakpoint, click resume
 . If you have set more than one breakpoint, the debugger pauses just before the next one.
- To step through the code line by line from the current breakpoint, click the down-arrow
 . You can resume at any point to finish debugging or to jump to the next breakpoint.
-
Check for errors in the _err variable at any point in the debugging process. Some errors pop up as toast
mensajes emergentes pequeños y temporales en la parte inferior de la pantalla que indican cosas como errores y éxitos. messages in the - To stop debugging, click the square
 .
- To make changes to your snippet:
- Stop the debugger, if it's running. While the debugger is running, the snippet is in read-only mode.
- Make your changes.
- Click Apply in the
- Reopen the
Paso a paso del Código de Snippets
Puede usar la herramienta de depuración para recorrer el fragmento de código línea por línea. Esto le permite ver cómo cambian las variables y sus valores a medida que se ejecuta cada línea.
- En Studio, abra un script que contenga una acción Snippet.
- Haga clic en Abrir editor en la acción Snippet.
- Add Snippet code, if it doesn't already contain some.
- On the left side of the Snippet editor window, click the bug . The Run & Debug panel slides out from the left side of the window.
-
Click in the column to the left of any line in the Snippet editor window. A red dot appears next to the line. This is a breakpoint, which marks the place from which you can start stepping through the code.
- Click the triangle to start debugging.
-
View the contents of the Variables section of the Run & Debug panel.
- Click the down-arrow in the Run & Debug panel to move to the next line in the snippet. The Variables section updates to show the variables and their values after executing the first line of snippet code.
- Repeat the preceding two steps for each line in the snippet. The Variables section continues to update after each line.
- If you want to skip the remaining lines of code, click resume . The Variables section displays the variables and their values when all of the snippet code has executed.
-
Check for errors in the _err variable at any point in the debugging process. Some errors pop up as toast
mensajes emergentes pequeños y temporales en la parte inferior de la pantalla que indican cosas como errores y éxitos. messages in the - To stop debugging, click the square , then repeat the debugging process if needed.
- To make changes to your snippet:
- Stop the debugger, if it's running. While the debugger is running, the snippet is in read-only mode.
- Make your changes.
- Click Apply in the
- Reopen the
Depurar utilizando la palabra clave TRACE
La palabra clave
La palabra clave
La sintaxis es: TRACE "<expression>"
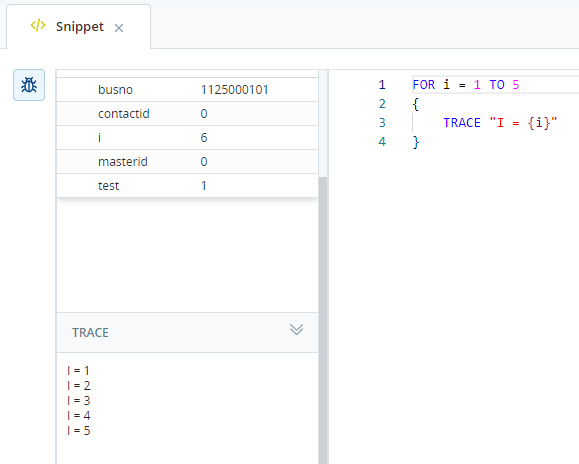
El texto entre comillas dobles se envía a la sección Seguimiento de la ventana Ejecutar y depurar en la ventana del editor
Puede utilizar la sustitución de variables entre las comillas dobles para imprimir el valor de las variables. Por ejemplo:
FOR i=1 TO 5
{
   TRACE "I = {i}"
}
El resultado de este ejemplo en la sección Seguimiento de la ventana Ejecutar y depurar es:
I = 1
I = 2
I = 3
I = 4
I = 5
Utilice la variable del sistema de prueba
The test variable is a system variable reserved for use in debugging snippets. It allows you to set the value of variables that are used in the snippet and would already be populated by the script before it hits the SNIPPET action.
When you use test in a snippet, it must be used as part of an IF statement and set to 1. The code between the curly brackets only executes when you run the snippet debugger because the La persona que interactúa con un agente, IVR o bot en su centro de contacto.,
For example:
IF test = {
 ASSIGN myDate = "07/03/2026" //This date falls on a Friday}
ASSIGN myDow = myDate.asdatedow
SWITCH myDow
{
 CASE 0   { ASSIGN newToday = "Sunday"  }
 CASE 1   { ASSIGN newToday = "Monday"  }
 CASE 2   { ASSIGN newToday = "Tuesday" }
 CASE 3   { ASSIGN newToday = "Wednesday" }
 CASE 4   { ASSIGN newToday = "Thursday" }
 CASE 5   { ASSIGN newToday = "Friday"  }
 CASE 6   { ASSIGN newToday = "Saturday"   }
}
In this example, the
- En NiCE CXone, haga clic en el selector de aplicaciones
 y seleccione Omnicanal Routing > Studio
 .
- En la página Scripts, ubique y haga doble clic para abrir el script con el que desea trabajar. Se abre el script en una nueva pestaña.
-
Open a SNIPPET action or add a new one to the canvas.
-
At the top of the
IF test = 1 { [code or variable assignments] } -
In place of [code or variable assignments], insert whatever code or
IF test = 1 { ASSIGN MyDate = "07/03/2026" //This date falls on a Friday } -
Add the snippet code that you want to test. For example:
ASSIGN myDow = myDate.asdatedow SWITCH myDow { CASE 0 { ASSIGN newToday = "Sunday" } CASE 1 { ASSIGN newToday = "Monday" } CASE 2 { ASSIGN newToday = "Tuesday" } CASE 3 { ASSIGN newToday = "Wednesday" } CASE 4 { ASSIGN newToday = "Thursday" } CASE 5 { ASSIGN newToday = "Friday" } CASE 6 { ASSIGN newToday = "Saturday" } } -
To test the code, click the bug
to open the debugger. -
Click Apply to save the snippet, then save your script.