

This help page is for Desktop Studio. This information is also available for Studio.
您可以從
- 檢查 snippet 中的語法。 您可以在編碼 snippet 的時候隨時這樣操作。 它不使用偵錯工具。
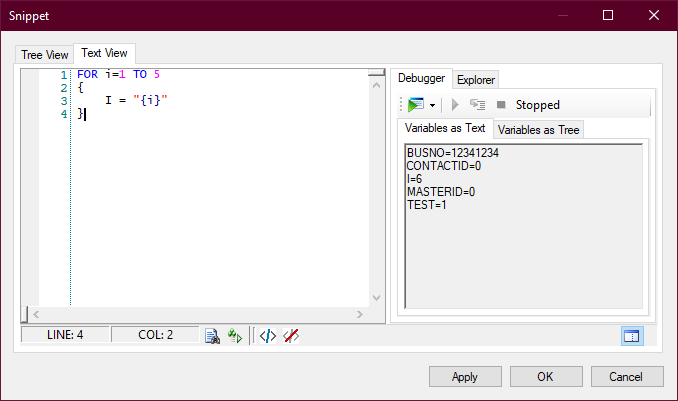
- 對整個 snippet 進行偵錯檢視整個 snippet 執行後的變數及其值。
- 設定一個中斷點在代碼的某一行停止偵錯。
- 逐步流覽snippet 代碼中的每一行,檢視變數及其數值如何逐行變化。
- 使用 TRACE 語句將資料輸出到
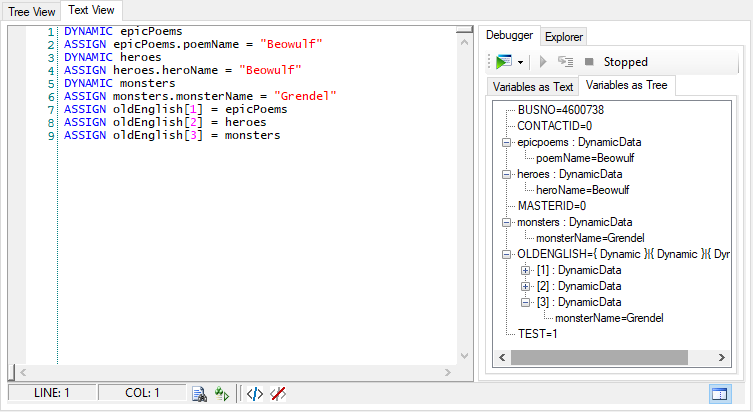
此外,如果您的代碼包含動態物件或陣列,您可以檢視其內容以及其如何變化。
檢查 Snippet 語法
您可以讓 Studio 檢查 snippet 中的語法。
- 在 Studio 中,開啟一個包含 Snippet 動作的指令碼。
- 點擊兩下 Snippet 動作。
- 如果沒有,請在
-
點擊
 。
。如果沒有發現語法錯誤,「檢查語法」圖示旁邊的狀態列會顯示訊息 Okay。
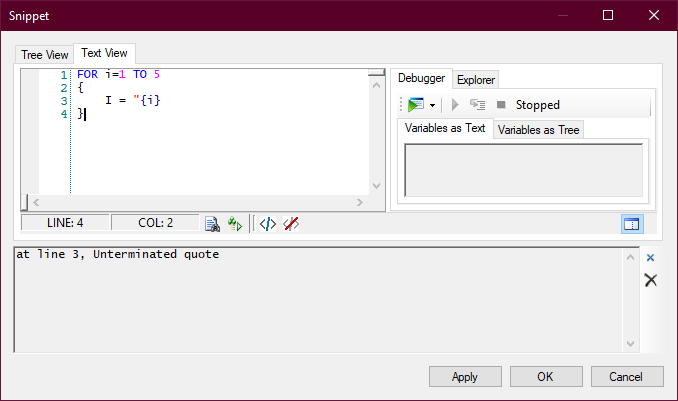
如果發現語法錯誤,會彈出錯誤訊息,描述錯誤。 描述包含錯誤所在的行號。 此外,「檢查語法」圖示旁邊的狀態欄位顯示訊息 Error at line [#]。
- 更正我們發現的語法問題。
- 您可以選擇 snippet 代碼中的一行或多行,然後點擊 Comment out selected lines 圖示
 。 如果您想跳過一個錯誤並檢查其餘的錯誤,這很有幫助。
 - 您可以在 snippet 中選擇一個或多個評論行,然後點擊 Uncomment the selected lines 圖示
 。
。
使用偵錯程式工具
- 在 Studio 中,開啟一個包含 Snippet 動作的指令碼。
- 點擊兩下 Snippet 動作。
- 如果沒有,請在
- 在
- 點擊 Debug 圖示
 右側的向下箭頭按鈕並選擇 Start
 。
。 -
如果代碼中存在任何語法錯誤,
- 糾正錯誤。
- 糾正錯誤後,點擊 Close 或 Clear Trace Output 圖示
 來關閉錯誤窗格。
 - 再次啟動偵錯程式。
- 檢視
- 您可以選擇 snippet 代碼中的一行或多行,然後點擊 Comment out selected lines 圖示 。 如果您想刪除一些代碼以查看偵錯結果如何變化,這很有幫助。
- 您可以選擇一行或多行的評論代碼,然後點擊 Uncomment the selected lines 圖示 將這些行重新新增到 snippet 中。
用一個中斷點進行偵錯
如果您想讓偵錯操作在 snippet 代碼的某一行停止,您可以設定一個中斷點。 這可以讓您在 snippet 中看到變數和數值,而不需要逐行瀏覽。
- 在 Studio 中,開啟一個包含 Snippet 動作的指令碼。
- 點擊兩下 Snippet 動作。
- 如果沒有,請在
-
在
- 在
- 點擊 Debug 圖示右側的向下箭頭按鈕並選擇 Start。
-
如果代碼中存在任何語法錯誤,
- 糾正錯誤。
- 糾正錯誤後,點擊 Close 或 Clear Trace Output 圖示 來關閉錯誤窗格。
- 再次啟動偵錯程式。
- 檢視
- 如果您完成了中斷點,再次點擊紅圈可將其清除。
- 如果您需要,請設定另一個中斷點。
- 要從中斷點繼續偵錯,請點擊 Resume 圖示
 。
。 - 要停止偵錯,請點擊 Stop Debugging
 圖示。
圖示。
逐步瀏覽 Snippet 代碼
您可以使用偵錯程式工具來逐行瀏覽該 snippet 代碼。 這可以讓您看到在執行每一行時,變數和變數的值是如何變化。
- 在 Studio 中,開啟一個包含 Snippet 動作的指令碼。
- 點擊兩下 Snippet 動作。
- 如果沒有,請在
- 在
- 點擊 Debug 圖示右側的向下箭頭按鈕並選擇 Start。
-
如果代碼中存在任何語法錯誤,
- 糾正錯誤。
- 糾正錯誤後,點擊 Close 或 Clear Trace Output 圖示 來關閉錯誤窗格。
- 再次啟動偵錯程式。
- 檢視
- 點擊 Step 圖示
 移到 snippet 的下一行。
 - 在 Snippet 中的每一行前重複前兩步。
- 如果您想跳過剩下的幾行代碼,請點擊 Resume 圖示 。
- 要停止偵錯,請點擊 Stop Debugging 圖示,然後從步驟 3 開始重複此過程。
檢視動態物件和陣列的內容
當您執行
- 在Studio中,點擊兩下
- 如有必要,新增 snippet 代碼。
- 在
- 在 ,選擇單步執行。 如果您不想逐行瀏覽代碼,可點擊開始偵錯圖示。
- 點擊步驟圖示,觀察
- 當您跳過所有的代碼行,或者如果您點擊了開始偵錯,
-
您可以點擊代碼中任何字串陣列或動態物件旁邊的 + 圖示來展開它們。 如果內容是另一個陣列或物件,您可以繼續展開樹狀,查看每個實體包含的內容。
使用 TRACE 進行偵錯

在
語法是:TRACE "<text>"
雙引號內的文字將輸出到
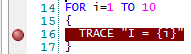
您可以在雙引號之間使用變數替換來列印變數的值。 範例:
FOR i=1 TO 5
{
   TRACE "I = {i}"
}
此範例的輸出結果是:
I = 1
I = 2
I = 3
I = 4
I = 5
使用測試系統變數
變數是保留用於調試代碼段的系統變數。 它允許您設置 snippet 中使用的變數的值,這些變數在腳本命中 操作之前就已經由腳本填充。
在 snippet 中使用 時,必須將其用作 語句的一部分並設置為 1。 大括弧之間的代碼僅在運行 snippet 調試器時執行,因為變數僅在調試器運行時等於 1。 當為 contact![]() 在聯絡中心與客服專員、IVR 或機器人互動的人。 運行指令碼時,的值為 0,因此忽略 語句中大括號之間的代碼。
在聯絡中心與客服專員、IVR 或機器人互動的人。 運行指令碼時,的值為 0,因此忽略 語句中大括號之間的代碼。
- 在 CXone Mpower 中,點擊應用程式選擇器
 並選擇全通路路由 > Studio
  。
。 - 在「指令碼」頁面中,找到並按兩下以開啟您要處理的。 指令碼在新標籤頁中打開。
-
打開動作或向畫布添加新動作。
-
Click the Text View tab.
-
在視窗頂部,添加以下代碼:
-
代替,插入設置運行 snippet 所需的初始條件所需的任何代碼或語句。
-
新增 snippet 所需的任何其他代碼。
-
若要測試代碼,請按下 bug
 以打開除錯器。
 -
點擊應用保存代碼片段,然後保存您的腳本。