

This help page is for Desktop Studio. This information is also available for Studio.
- スニペット内の構文をチェックする。 スニペットをコーディングしている間、いつでも行うことができます。 デバッガツールは使用しません。
- スニペット全体をデバッグして、スニペット全体が実行された後に変数とその値を確認する。
- ブレークポイントを設定し、コード内の特定の行でデバッグを停止する。
- スニペットコードの各行をステップスルーして、変数とその値がどのように変化するかを1行ずつ確認する。
- TRACEステートメントを使用して、
また、コードに動的オブジェクトや配列が含まれている場合は、それらの内容を表示してその変化を確認できます。
スニペットの構文をチェックする
Studioでスニペット内の構文をチェックできます。
- Studioで、Snippetアクションを含むスクリプトを開きます。
- Snippetアクションをダブルクリックします。
-
-
 をクリックします。
構文エラーがない場合、構文チェックアイコンの横にあるステータスフィールドにOkayというメッセージが表示されます。
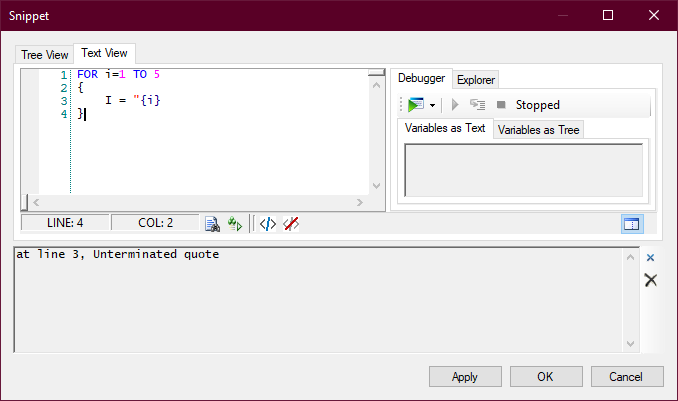
構文エラーが見つかった場合は、エラーを説明するメッセージがポップアップ表示されます。 この説明には、エラーのある行番号が含まれています。 さらに、構文チェックアイコンの隣のステータスフィールドに、Error at line [#]というメッセージが表示されます。
- 見つかった構文の問題をすべて修正します。
- スニペットコード内の行を1つ以上選択し、Comment out selected linesアイコン
 をクリックできます。 これは、エラーをスキップして残りのエラーをチェックする場合に便利です。
 - スニペットコード内のコメントアウトされた行を1つ以上選択し、Uncomment the selected linesアイコン
 をクリックすることができます。
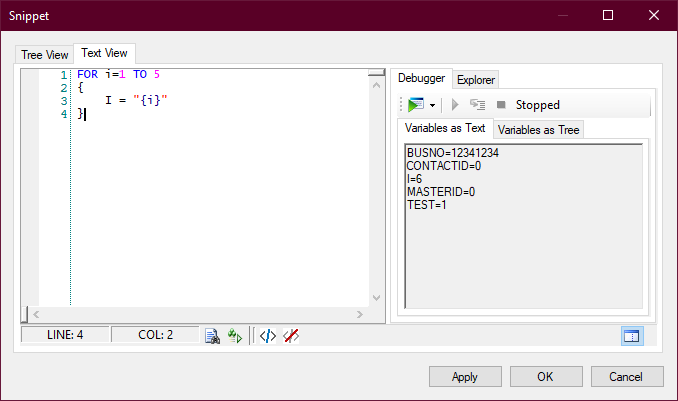
デバッガツールを使用する
- Studioで、Snippetアクションを含むスクリプトを開きます。
- Snippetアクションをダブルクリックします。
-
-
- Debugアイコン
 の右側にある下矢印ボタンをクリックし、Start
 を選択します。
 -
コードに構文エラーがある場合は、
- エラーを修正します。
- エラーを修正したら、CloseまたはClear Trace Outputアイコン
 をクリックしてエラーペインを閉じます。
 - デバッガーをもう一度起動します。
-
- スニペットコード内の行を1つ以上選択し、Comment out selected linesアイコンをクリックできます。 これは、コードの一部を削除して、デバッグの結果がどのように変わるかを確認したい場合に便利です。
- コメントアウトされたコードを1行以上選択し、Uncomment the selected linesアイコンをクリックすると、それらの行をスニペットに戻すことができます。
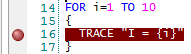
ブレークポイントを使ってデバッグする
スニペットコードの特定の行でデバッグを停止したい場合は、ブレークポイントを設定できます。 これにより、スニペットを1行ずつステップスルーすることなく、スニペットの途中で変数や値を確認できます。
- Studioで、Snippetアクションを含むスクリプトを開きます。
- Snippetアクションをダブルクリックします。
-
-
-
- Debugアイコンの右側にある下矢印ボタンをクリックし、Startを選択します。
-
コードに構文エラーがある場合は、
- エラーを修正します。
- エラーを修正したら、CloseまたはClear Trace Outputアイコンをクリックしてエラーペインを閉じます。
- デバッガーをもう一度起動します。
-
- ブレークポイントの確認が終わったら、赤い丸をもう一度クリックしてクリアします。
- 必要であれば、別のブレークポイントを設定してください。
- ブレークポイントからデバッグを続行するには、Resumeアイコン
 をクリックします。
 - デバッグを停止するには、Stop Debugging
 アイコンをクリックします。
スニペットコードをステップスルーする
デバッガツールを使用して、スニペットコードを1行ずつステップスルーすることができます。 これにより、各行が実行されるたびに変数とその値がどのように変化するかを確認できます。
- Studioで、Snippetアクションを含むスクリプトを開きます。
- Snippetアクションをダブルクリックします。
-
-
- Debugアイコンの右側にある下矢印ボタンをクリックし、Startを選択します。
-
コードに構文エラーがある場合は、
- エラーを修正します。
- エラーを修正したら、CloseまたはClear Trace Outputアイコンをクリックしてエラーペインを閉じます。
- デバッガーをもう一度起動します。
-
- Stepアイコン
 をクリックして、スニペットの次の行に移動します。
 - スニペット内の各行について、前の2つのステップを繰り返します。
- 残りの行をスキップするには、Resumeアイコンをクリックします。
- デバッグを中止してやり直す場合は、Stop Debuggingアイコンをクリックし、ステップ3からこのプロセスを繰り返します。
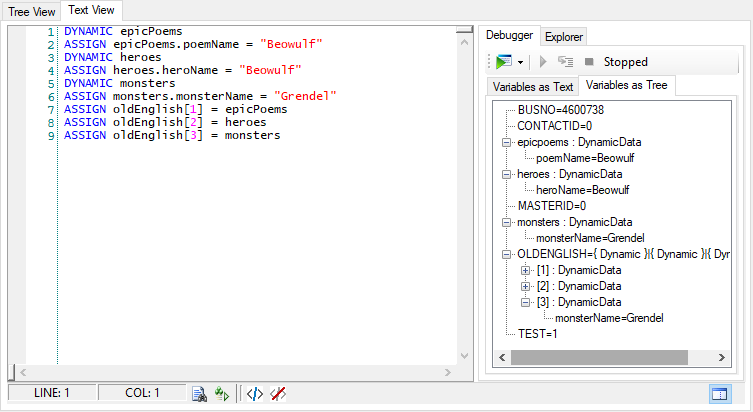
動的オブジェクトと配列の内容を表示する
- Studioで、
- 必要であればスニペットコードを追加します。
-
-
の隣にある下矢印をクリックし、ステップインを選択します。 コードを1行ずつ確認したくない場合は、デバッグ開始アイコンをクリックします。
- ステップ
アイコンをクリックして
- すべてのコード行のステップスルーが終了した場合、またはデバッグ開始をクリックした場合、
-
コード内の任意の文字列配列または動的オブジェクトの隣にある+アイコンをクリックして、それらを展開することができます。 コンテンツが別の配列またはオブジェクトの場合は、ツリーの展開を続けて、各エンティティに含まれる内容を確認できます。
TRACEを使ってデバッグする
構文は次のとおりです:TRACE "<text>"
二重引用符内のテキストは
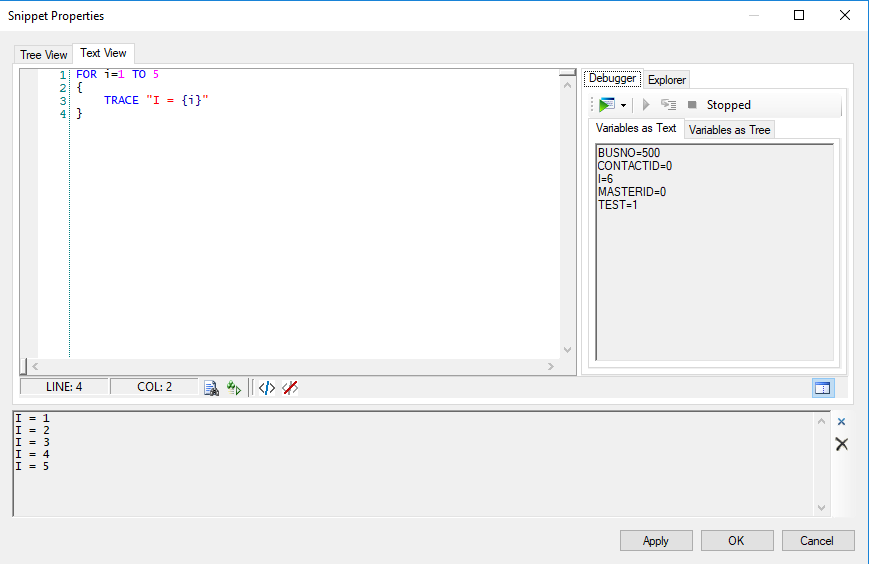
変数の値を出力するには、二重引用符内で変数代入を使用します。 以下に例を示します。
FOR i=1 TO 5
{
   TRACE "I = {i}"
}
この例の出力は次のようになります。
I = 1
I = 2
I = 3
I = 4
I = 5
テストシステム変数を使用する
変数は、スニペットのデバッグで使用するために予約されているシステム変数です。 これにより、スニペットで使用され、アクションにヒットする前にスクリプトによってすでに入力されている変数の値を設定できます。
スニペットでを使用する場合は、 ステートメントの一部として使用し、1に設定する必要があります。 中括弧で囲まれたコードは、デバッガーの実行時に変数が 1 としか等しくないため、スニペットデバッガーの実行時にのみ実行されます。 スクリプトがcontact![]() コンタクトセンターでエージェント、IVR、またはボットとやり取りする人。に対して実行されると、の値は0になるため、ステートメントの中括弧で囲まれたコードは無視されます。
コンタクトセンターでエージェント、IVR、またはボットとやり取りする人。に対して実行されると、の値は0になるため、ステートメントの中括弧で囲まれたコードは無視されます。
- CXone Mpowerで、アプリセレクター
 をクリックし、選択します:オムニチャネルルーティング>Studio
 。
。 - スクリプトページで、使用するスクリプトを作成します。 スクリプトが新しいタブで開きます。
-
アクションを開くか、キャンバスに新しいアクションを追加します。
-
Click the Text View tab.
-
ウィンドウの上部に、次のコードを追加します。
-
の代わりに、スニペットの実行に必要な初期条件を設定するために必要なコードまたはステートメントを挿入します。
-
スニペットに必要なその他のコードを追加します。
-
コードをテストするには、バグ
 をクリックしてデバッガを開きます。
 -
適用をクリックしてスニペットを保存し、スクリプトを保存します。