
Cette page d'aide concerne Studio. Ces informations sont également disponibles pour Desktop Studio.
Vous pouvez déboguer les snippets à partir de la fenêtre de l'Éditeur de snippets de
- Déboguer l'ensemble du snippet pour voir les variables et leurs valeurs après l'exécution de l'ensemble du snippet.
- Définir un point d'arrêt pour arrêter le débogage à une ligne précise du code.
- Faire dfiler chaque ligne du snippet afin de voir comment les variables et leurs valeurs changent ligne par ligne.
- Utiliser des instructions TRACE pour produire des données dans le volet
En outre, si votre code contient des objets dynamiques ou des tableaux, vous pouvez voir leur contenu et la façon dont il change.
Si vous avez des DLL SOAP personnalisées dans votre unité commerciale Regroupement organisationnel de haut niveau utilisé pour gérer le soutien technique, la facturation et les paramètres globaux de votre système NiCE CXone., elles ne sont pas incluses lors du débogage des extraits.
Utilisation de l'outil de débogueur
- Dans Studio, ouvrez un script contenant une action Snippet.
- Cliquez sur Ouvrir l'Éditeur
 sur l'action Snippet.
- Add Snippet code, if it doesn't already contain some.
- On the left side of the Snippet editor window, click the bug
 . The Run & Debug panel slides out from the left side of the window.
- Click the triangle
 to start debugging.
-
View the contents of the Variables section of the Run & Debug panel.
-
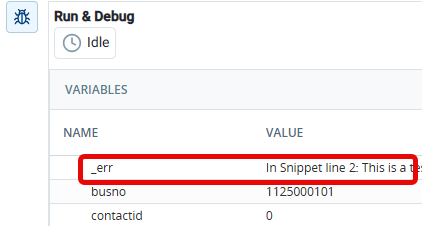
Check for errors in the _err variable at any point in the debugging process. Some errors pop up as toast
Petits messages contextuels temporaires affichés au bas de l'écran indiquant des éléments tels que des erreurs et des réussites. messages in the - To make changes to your snippet:
- Stop the debugger, if it's running. While the debugger is running, the snippet is in read-only mode.
- Make your changes.
- Click Apply in the
- Reopen the
Débogage avec un point d'arrêt
Vous pouvez définir un point d'arrêt si vous souhaitez que le débogage s'arrête à une ligne spécifique du code de du snippet. Vous pouvez définir plusieurs points d’arrêt et demander au débogueur de passer d’un point d’arrêt à l’autre. Cela vous permet de voir les variables et les valeurs à des points spécifiques de l'extrait sans le parcourir ligne par ligne.
Vous pouvez définir des points d'arrêt avant de démarrer le débogueur ou pendant son exécution. Le débogage s'arrête lorsque la ligne avec le point d'arrêt est sur le point d'être exécutée. Pendant la pause, vous pouvez voir la valeur actuelle de toutes les variables de l'extrait dans la section Variables de la fenêtre Exécuter et déboguer.
- Dans Studio, ouvrez un script contenant une action Snippet.
- Cliquez sur Ouvrir l'Éditeur sur l'action Snippet.
- Add Snippet code, if it doesn't already contain some.
- On the left side of the Snippet editor window, click the bug . The Run & Debug panel slides out from the left side of the window.
-
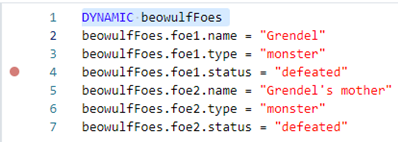
Add a breakpoint by clicking in the column to the left of any line in the Snippet editor window. A red dot appears next to the line number. You can add more than one breakpoint to the snippet. You can also add breakpoints while the debugger is running.
- Click the triangle to start debugging.
-
View the contents of the Variables section of the Run & Debug panel.
 appears in the breakpoint column.
- If you're done with a breakpoint, click the red circle again to clear it.
- To continue debugging from the breakpoint, click resume
 . If you have set more than one breakpoint, the debugger pauses just before the next one.
- To step through the code line by line from the current breakpoint, click the down-arrow
 . You can resume at any point to finish debugging or to jump to the next breakpoint.
-
Check for errors in the _err variable at any point in the debugging process. Some errors pop up as toast
Petits messages contextuels temporaires affichés au bas de l'écran indiquant des éléments tels que des erreurs et des réussites. messages in the - To stop debugging, click the square
 .
- To make changes to your snippet:
- Stop the debugger, if it's running. While the debugger is running, the snippet is in read-only mode.
- Make your changes.
- Click Apply in the
- Reopen the
Défilement dans le code de snippet
Vous pouvez utiliser l'outil de débogage pour faire défiler le code de snippet par ligne. Cela vous permet de voir comment les variables et leurs valeurs changent au fur et à mesure de l'exécution de chaque ligne.
- Dans Studio, ouvrez un script contenant une action Snippet.
- Cliquez sur Ouvrir l'Éditeur sur l'action Snippet.
- Add Snippet code, if it doesn't already contain some.
- On the left side of the Snippet editor window, click the bug . The Run & Debug panel slides out from the left side of the window.
-
Click in the column to the left of any line in the Snippet editor window. A red dot appears next to the line. This is a breakpoint, which marks the place from which you can start stepping through the code.
- Click the triangle to start debugging.
-
View the contents of the Variables section of the Run & Debug panel.
- Click the down-arrow in the Run & Debug panel to move to the next line in the snippet. The Variables section updates to show the variables and their values after executing the first line of snippet code.
- Repeat the preceding two steps for each line in the snippet. The Variables section continues to update after each line.
- If you want to skip the remaining lines of code, click resume . The Variables section displays the variables and their values when all of the snippet code has executed.
-
Check for errors in the _err variable at any point in the debugging process. Some errors pop up as toast
Petits messages contextuels temporaires affichés au bas de l'écran indiquant des éléments tels que des erreurs et des réussites. messages in the - To stop debugging, click the square , then repeat the debugging process if needed.
- To make changes to your snippet:
- Stop the debugger, if it's running. While the debugger is running, the snippet is in read-only mode.
- Make your changes.
- Click Apply in the
- Reopen the
Déboguer à l'aide du mot-clé TRACE
Le mot-clé
Le mot-clé
La syntaxe est la suivante : TRACE "<expression>"
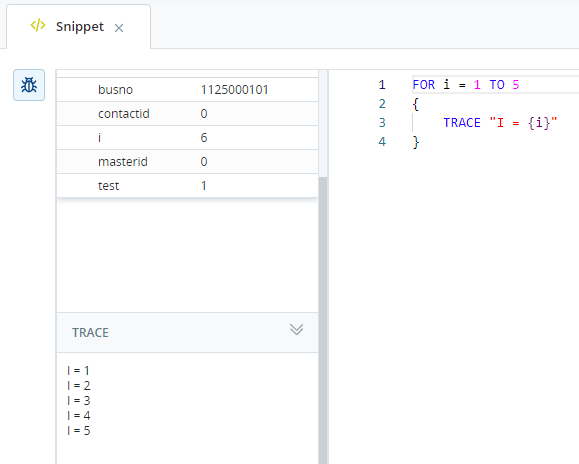
Le texte entre guillemets est envoyé vers la section Trace de la fenêtre Exécuter et déboguer dans la fenêtre de l'éditeur
Vous pouvez utiliser la substitution de variable entre les guillemets doubles pour imprimer la valeur des variables. Par exemple :
FOR i=1 TO 5
{
   TRACE "I = {i}"
}
La sortie de cet exemple dans la section Trace de la fenêtre Exécuter et déboguer est :
I = 1
I = 2
I = 3
I = 4
I = 5
Utiliser la variable système de test
The test variable is a system variable reserved for use in debugging snippets. It allows you to set the value of variables that are used in the snippet and would already be populated by the script before it hits the SNIPPET action.
When you use test in a snippet, it must be used as part of an IF statement and set to 1. The code between the curly brackets only executes when you run the snippet debugger because the La personne qui interagit avec un agent, un SRVI ou un robot dans votre centre d’appels.,
For example:
IF test = {
 ASSIGN myDate = "07/03/2026" //This date falls on a Friday}
ASSIGN myDow = myDate.asdatedow
SWITCH myDow
{
 CASE 0   { ASSIGN newToday = "Sunday"  }
 CASE 1   { ASSIGN newToday = "Monday"  }
 CASE 2   { ASSIGN newToday = "Tuesday" }
 CASE 3   { ASSIGN newToday = "Wednesday" }
 CASE 4   { ASSIGN newToday = "Thursday" }
 CASE 5   { ASSIGN newToday = "Friday"  }
 CASE 6   { ASSIGN newToday = "Saturday"   }
}
In this example, the
- Dans NiCE CXone, cliquez sur le sélecteur d'application
 et sélectionnez Omnicanal Routing > Studio
 .
- Dans la page Scripts, localisez et double-cliquez pour ouvrir le script avec lequel vous souhaitez travailler avec . Le script s’ouvre dans un nouvel onglet.
-
Open a SNIPPET action or add a new one to the canvas.
-
At the top of the
IF test = 1 { [code or variable assignments] } -
In place of [code or variable assignments], insert whatever code or
IF test = 1 { ASSIGN MyDate = "07/03/2026" //This date falls on a Friday } -
Add the snippet code that you want to test. For example:
ASSIGN myDow = myDate.asdatedow SWITCH myDow { CASE 0 { ASSIGN newToday = "Sunday" } CASE 1 { ASSIGN newToday = "Monday" } CASE 2 { ASSIGN newToday = "Tuesday" } CASE 3 { ASSIGN newToday = "Wednesday" } CASE 4 { ASSIGN newToday = "Thursday" } CASE 5 { ASSIGN newToday = "Friday" } CASE 6 { ASSIGN newToday = "Saturday" } } -
To test the code, click the bug
to open the debugger. -
Click Apply to save the snippet, then save your script.