

Die Berichterstellung ![]() in CXone Mpower Agent Integrated zeigt Berichte mit Daten an, die Ihnen bei der Bewertung Ihrer Leistung helfen. Es gibt zwei Berichte: den Produktivitätsbericht und den Leistungsbericht. Um auf diese Berichte zuzugreifen, klicken Sie im
in CXone Mpower Agent Integrated zeigt Berichte mit Daten an, die Ihnen bei der Bewertung Ihrer Leistung helfen. Es gibt zwei Berichte: den Produktivitätsbericht und den Leistungsbericht. Um auf diese Berichte zuzugreifen, klicken Sie im ![]() . Berichte werden in Ihrer Zeitzone angezeigt.
. Berichte werden in Ihrer Zeitzone angezeigt.
Die Daten in Berichten werden aktualisiert, wenn Sie:
-
Öffnen Sie Berichterstellung
 .
. -
Wechseln Sie zwischen den Produktivitäts- und Leistungsberichten.
-
Wählen Sie einen neuen Datumsbereich: Heute, Gestern, Letzte 7 Tageoder Benutzerdefiniert.
Es kann einige Zeit dauern, bis die Berichte die neuesten Daten anzeigen.
Produktivitätsbericht
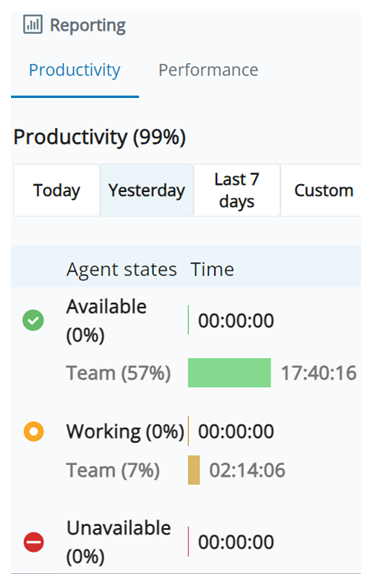
Der Produktivitätsbericht zeigt, wie viel Zeit Sie in jedem dieser Status![]() Ergebnisse, die einer Interaktion an derem Ende vom Agenten oder System zugewiesen werden; bei Sprachinteraktionen als Disposition und bei digitalen Interaktionen als Status und Detailstatus verbracht haben:
Ergebnisse, die einer Interaktion an derem Ende vom Agenten oder System zugewiesen werden; bei Sprachinteraktionen als Disposition und bei digitalen Interaktionen als Status und Detailstatus verbracht haben:
| Status | Detailstatus |
|---|---|
|
Verfügbar |
Für "Verfügbar" gibt es keine Detailstatus. |
| Tätig |
Mögliche Detailstatus von "Tätig" sind:
Anrufe, die direkt an andere Agenten im Contact Center gerichtet sind, werden nicht in diese Arbeits-Teilzustände einbezogen. |
|
Nicht verfügbar |
Nicht verfügbare Unterzustände werden von Ihrem Administrator konfiguriert. Diese werden individuell für Ihr Unternehmen eingerichtet. |
Im Produktivitätsbericht werden die folgenden Werte angezeigt:
-
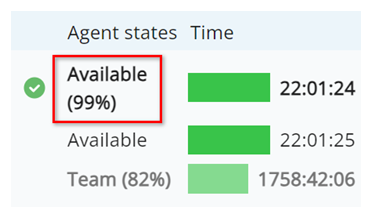
Prozentsatz der Zeit, die Sie im jeweiligen Status verbracht haben. Diese Werte stehen in Klammern neben dem Namen des jeweiligen Status.
-
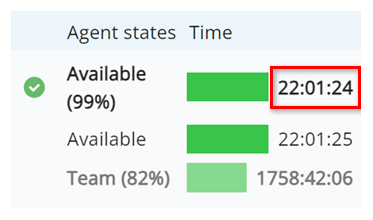
Die Zeit, die Sie im jeweiligen Status verbracht haben, im folgenden Format: HH:MM:SS. Diese Werte stehen neben den Balken für den jeweiligen Status.
-
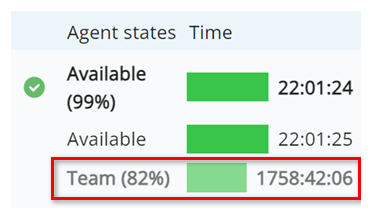
Prozentsatz und Zeit, den/die Ihr Team im jeweiligen Status verbracht hat. Diese Werte werden durch grauen Text und hellere Balken angegeben.
Leistungsreport
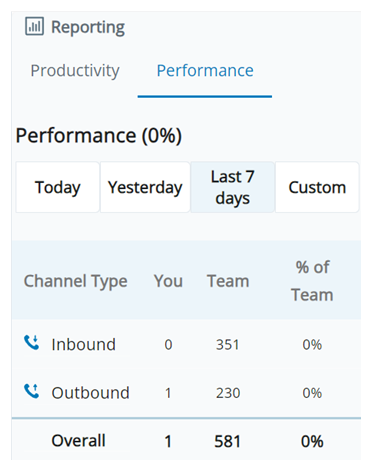
Der Leistungsbericht zeigt:
- Die Anzahl der eingehenden und ausgehenden Interaktionen, die Sie bearbeitet haben.
- Die Anzahl der eingehenden und ausgehenden Interaktionen, die Ihr Team bearbeitet hat.
- Der Prozentsatz der eingehenden und ausgehenden Interaktionen, die Sie bearbeitet haben.