

This help page is for Studio. This information is also available for Desktop Studio.
You can debug snippets from the
- Debug the whole snippet to see variables and their values after the whole snippet has been executed.
- Set a breakpoint to stop debugging at a certain line in the code.
- Step through each line in the snippet code and see how the variable and their values change line by line.
- Use TRACE statements to output data to the
Additionally, if your code contains dynamic objects or arrays, you can see their contents and how it changes.
If you have custom SOAP DLLs in your business unit![]() High-level organizational grouping used to manage technical support, billing, and global settings for your NiCE CXone system., they're not included when debugging snippets.
High-level organizational grouping used to manage technical support, billing, and global settings for your NiCE CXone system., they're not included when debugging snippets.
Use the Debugger Tool
- In Studio, open a script containing a Snippet action.
- Click Open Editor
 on the Snippet action.
 - Add Snippet code, if it doesn't already contain some.
- On the left side of the Snippet editor window, click the bug
 . The Run & Debug panel slides out from the left side of the window.
 - Click the triangle
 to start debugging.
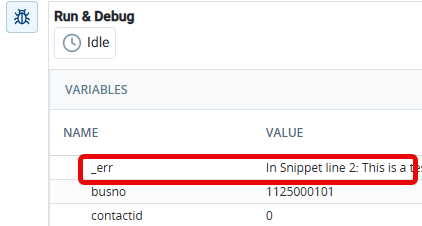
 - View the contents of the Variables section of the Run & Debug panel.
-
Check for errors in the _err variable at any point in the debugging process. Some errors pop up as toast
 Small, temporary pop-up messages on the bottom of the screen indicating things like errors and successes. messages in the
 - To make changes to your snippet:
- Stop the debugger, if it's running. While the debugger is running, the snippet is in read-only mode.
- Make your changes.
- Click Apply in the
- Reopen the
Debug with a Breakpoint
You can set a breakpoint if you want debugging to stop at a specific line in the snippet code. You can set more than one breakpoint and have the debugger skip from breakpoint to breakpoint. This allows you to see the variables and values at specific points in the snippet without stepping through it line by line.
You can set breakpoints before you start the debugger or while it's running. The debugging pauses when the line with the breakpoint is about to be executed. While paused, you can see the current value of all variables in the snippet in the Variables section of the Run & Debug window.
- In Studio, open a script containing a Snippet action.
- Click Open Editor on the Snippet action.
- Add Snippet code, if it doesn't already contain some.
- On the left side of the Snippet editor window, click the bug . The Run & Debug panel slides out from the left side of the window.
-
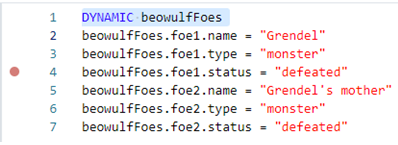
Add a breakpoint by clicking in the column to the left of any line in the Snippet editor window. A red dot appears next to the line number. You can add more than one breakpoint to the snippet. You can also add breakpoints while the debugger is running.
- Click the triangle to start debugging.
- View the contents of the Variables section of the Run & Debug panel.
 appears in the breakpoint column.
 - If you're done with a breakpoint, click the red circle again to clear it.
- To continue debugging from the breakpoint, click resume
 . If you have set more than one breakpoint, the debugger pauses just before the next one.
 - To step through the code line by line from the current breakpoint, click the down-arrow
 . You can resume at any point to finish debugging or to jump to the next breakpoint.
 -
Check for errors in the _err variable at any point in the debugging process. Some errors pop up as toast
Small, temporary pop-up messages on the bottom of the screen indicating things like errors and successes. messages in the - To stop debugging, click the square
 .
. - To make changes to your snippet:
- Stop the debugger, if it's running. While the debugger is running, the snippet is in read-only mode.
- Make your changes.
- Click Apply in the
- Reopen the
Step Through Snippet Code
You can use the debugger tool to step through the snippet code line by line. This allows you to see how the variables and their values change as each line is executed.
- In Studio, open a script containing a Snippet action.
- Click Open Editor on the Snippet action.
- Add Snippet code, if it doesn't already contain some.
- On the left side of the Snippet editor window, click the bug . The Run & Debug panel slides out from the left side of the window.
-
Click in the column to the left of any line in the Snippet editor window. A red dot appears next to the line. This is a breakpoint, which marks the place from which you can start stepping through the code.
- Click the triangle to start debugging.
- View the contents of the Variables section of the Run & Debug panel.
- Click the down-arrow in the Run & Debug panel to move to the next line in the snippet. The Variables section updates to show the variables and their values after executing the first line of snippet code.
- Repeat the preceding two steps for each line in the snippet. The Variables section continues to update after each line.
- If you want to skip the remaining lines of code, click resume . The Variables section displays the variables and their values when all of the snippet code has executed.
-
Check for errors in the _err variable at any point in the debugging process. Some errors pop up as toast
Small, temporary pop-up messages on the bottom of the screen indicating things like errors and successes. messages in the - To stop debugging, click the square , then repeat the debugging process if needed.
- To make changes to your snippet:
- Stop the debugger, if it's running. While the debugger is running, the snippet is in read-only mode.
- Make your changes.
- Click Apply in the
- Reopen the
Debug using the TRACE Keyword
The
The
The syntax is: TRACE "<expression>"
Text within the double quotes is output to Trace section of the Run & Debug window in the
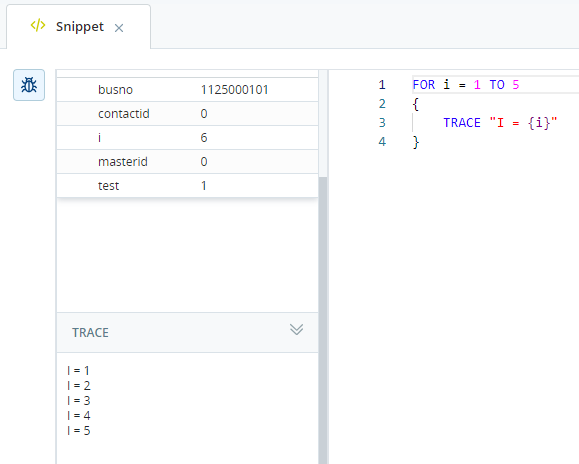
You can use variable substitution between the double quotes to print the value of variables. For example:
FOR i=1 TO 5
{
   TRACE "I = {i}"
}
The output from this example in the Trace section of the Run & Debug window is:
I = 1
I = 2
I = 3
I = 4
I = 5
Use the Test System Variable
The test variable is a system variable reserved for use in debugging snippets. It allows you to set the value of variables that are used in the snippet and would already be populated by the script before it hits the SNIPPET action.
When you use test in a snippet, it must be used as part of an IF statement and set to 1. The code between the curly brackets only executes when you run the snippet debugger because the ![]() The person interacting with an agent, IVR, or bot in your contact center.,
The person interacting with an agent, IVR, or bot in your contact center.,
For example:
IF test = {
 ASSIGN myDate = "07/03/2026" //This date falls on a Friday}
ASSIGN myDow = myDate.asdatedow
SWITCH myDow
{
 CASE 0   { ASSIGN newToday = "Sunday"  }
 CASE 1   { ASSIGN newToday = "Monday"  }
 CASE 2   { ASSIGN newToday = "Tuesday" }
 CASE 3   { ASSIGN newToday = "Wednesday" }
 CASE 4   { ASSIGN newToday = "Thursday" }
 CASE 5   { ASSIGN newToday = "Friday"  }
 CASE 6   { ASSIGN newToday = "Saturday"   }
}
In this example, the
- In NiCE CXone, click the app selector
 and select Omnichannel Routing > Studio
  .
. - On the Scripts page, locate and double-click to open the script you want to work with. The script opens in a new tab.
-
Open a SNIPPET action or add a new one to the canvas.
-
At the top of the
IF test = 1 { [code or variable assignments] } -
In place of [code or variable assignments], insert whatever code or
IF test = 1 { ASSIGN MyDate = "07/03/2026" //This date falls on a Friday } -
Add the snippet code that you want to test. For example:
ASSIGN myDow = myDate.asdatedow SWITCH myDow { CASE 0 { ASSIGN newToday = "Sunday" } CASE 1 { ASSIGN newToday = "Monday" } CASE 2 { ASSIGN newToday = "Tuesday" } CASE 3 { ASSIGN newToday = "Wednesday" } CASE 4 { ASSIGN newToday = "Thursday" } CASE 5 { ASSIGN newToday = "Friday" } CASE 6 { ASSIGN newToday = "Saturday" } } -
To test the code, click the bug
 to open the debugger.
 -
Click Apply to save the snippet, then save your script.