

Voice Quality Metrics provides you access to call quality data in NiCE CXone. It monitors SIP Protocol used for signaling and controlling multimedia communication sessions such as voice and video calls. voice traffic and agents' WebRTC sessions. You can access useful call data like the ISP, location, average bit rate, and average round trip time (RTT). This granular information helps you troubleshoot call quality issues for both contact and agent call legs The portion of an interaction that takes place between NiCE CXone and the agent.. Voice Quality Metrics saves this call quality data for each contact ID A unique numerical identifier assigned to each contact. for 30 days.
This application helps you identify contact IDs that have call quality problems. To dig deeper into issues and find exact causes, you can combine Voice Quality Metrics with these other features:
-
NiCE CXone Voice Diagnostics: Lets you view more in-depth call data at the level of individual call legs. It helps you pinpoint exactly where a call issue may have occurred in the connection. For example, you can see a breakdown of each RTP stream for the call. You can also review the call ladder
A diagram that provides in-depth details about a call's traffic, like individual server communications, SIP information, requested URIs, and so forth. to see which servers had connection issues.Learn more about Voice Diagnostics
Voice Diagnostics is an add-on to Voice Quality Metrics (VQM) that provides deeper insights into call performance and network conditions. While VQM focuses on high-level voice quality metrics, Voice Diagnostics offers granular, call-level and network-level details to help you troubleshoot issues proactively.
Key Capabilities:
-
Detailed Call Analysis
Access information such as SIP call headers and WebRTC smartphone details for each call. This also includes granular data like device and headset configuration, geolocation, connection strength, and so forth. -
Network-Level Insights
Identify issues related to agent hardware, network connectivity, and configuration settings. For example, you can see whether the callers were using Wi-Fi, a public network, and so forth. -
Proactive Troubleshooting
Pinpoint the root cause of poor call quality, whether it’s on the agent side or the customer side, without relying on external tools. -
Enhanced Productivity and Satisfaction
By resolving voice quality issues quickly, agents can maintain higher productivity and deliver better customer experiences.
Example use case:
An agent in France experiences poor call quality with a customer in Germany. Using Voice Diagnostics, you determine:
-
The customer’s connection is stable.
-
The agent is on a public Wi-Fi network and using an incorrect headset.
This level of precision enables fast resolution and prevents recurring issues.
-
-
Call Quality Explorer: This provides insight into the routing and how calls are connected. It displays information like call events, trunk groups, and devices. You can quickly see the sequence of events during the call, like a missing packets event or a CTI trigger event. Starting with a single contact ID, you can also track any associated IDs or where problematic events continued. If a call has associated IDs, you can also view the call's MegaLadder. This is like the call ladder in Voice Diagnostics, showing the call timeline and server traffic.
-
WebRTC Analytics: An interactive page displaying all WebRTC data. You can track basic information like the tenant
High-level organizational grouping used to manage technical support, billing, and global settings for your NiCE CXone system., agent application, and locations. You can also see more in-depth data like timelines for jitter or bitrates.
Contact your account representative for more information. These additional features provide more granular information to help you troubleshoot effectively.
Call Quality Metrics
Voice Quality Metrics uses metrics and data from a variety of sources, including:
-
Metrics from the NiCE CXone voice network collected via monitoring probes. These include mean opinion score (MOS), R-factor, jitter, and packet loss .
-
Quality of service measurements for both the NiCE CXone network and the external network. This makes it easier to determine the source of voice issues. An overall average call quality is also provided for each contact ID.
-
Call-related data from the ACD like agent name, skills
Used to automate delivery of interactions based on agent skills, abilities, and knowledge., contact IDs, call disconnect reasons, and so on. -
Filter capabilities to determine quality of service performance by business segment, like teams, skills, POC
The entry point that an inbound contact uses to initiate an interaction, such as a phone number or email address.s, or agents. -
If you have call recording set up, you can review the recordings and view a breakdown of the recordings.
Call Score
One primary method of assessing call quality is the call score. A score is assigned to each contact ID. Voice Quality Metrics calculates the score based on its mean opinion score (MOS). This is a numeric score that indicates the quality of the call from the user's perspective. The score ranges from 1 (lowest) to 5 (highest). It's calculated using transport data gathered from the media streams, both upstream and downstream. The data include bandwidth, jitter, latency, and packet loss.
Voice Quality Metrics uses the following standards to define call quality for each contact ID:
| MOS | COLOR CODING | CALL QUALITY |
|---|---|---|
| 4.3 to 5.0 |
 Green Green |
Excellent |
|
3.5 to 4.2 |
|
Good |
| 3 to 3.4 |
 Orange Orange |
Moderate |
| 0 to 2.9 |
 Red Red |
Poor |
 Blue
BlueJitter
In networking, jitter refers to small, intermittent delays during data transfer. Many things can contribute to jitter, such as:
-
Network congestion.
-
Network collisions.
-
Signal interference.
A jitter value greater than 99 MS can result in packet loss, which can mean lower voice quality.
| JITTER (MS) | COLOR CODING | CALL QUALITY |
|---|---|---|
| 0 to 30 |
Green |
Excellent |
|
31 to 99 |
|
Good |
| 100 to 149 |
Orange |
Moderate |
| 150 |
Red |
Poor |
Packet Loss
In networking, packet loss happens when a transmitted packet does not reach its destination. Routers or switches can drop packets due to network congestion. Packets can also be discarded by the jitter buffer. The more packet loss a call experiences, the lower the call quality.
| PACKET LOSS (%) | COLOR CODING | CALL QUALITY |
|---|---|---|
| <1 |
Green |
Excellent |
|
<1 to 2.9 |
|
Good |
| 3 to 5 |
Orange |
Moderate |
| >5 |
Red |
Poor |
R-Factor
R-factor is another measure of call quality that Voice Quality Metrics considers. R-factor is calculated based on factors such as jitter, delay, and packet loss.
| R-FACTOR | COLOR CODING | CALL QUALITY |
|---|---|---|
| 90 to 100 |
Green |
Excellent |
|
80 to 89 |
|
Good |
| 70 to 79 |
Orange |
Moderate |
| 0 to 69 |
Red |
Poor |
Voice Quality Metrics Availability
The following table shows the global regions where Voice Quality Metrics is available.
| Region | Voice Quality Metrics Integration |
|---|---|
| North America |

|
| Canada | |
| Europe |
|
| United Kingdom | |
| Australia |
|
| Japan |
*If a hosting region is not listed in the table, Voice Quality Metrics is not yet available there.
Voice Quality Metrics Interface
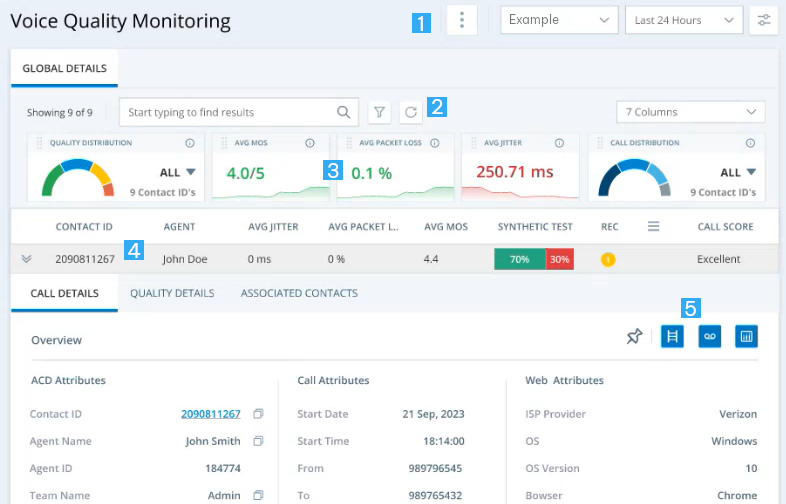
| Interface Element | Details |
|---|---|
| 1 - Load Criteria |
These options let you view data for a specific tenant and time range. Specifying this information helps you filter and find call segments faster. By default, Voice Quality Metrics displays calls and call data for the last hour. You can pull calls for up to 30 days in the past. The global filter lets you limit the calls that you request from the database. Instead of displaying every call from your time range, then filtering the list, the global filter limits the database query. This makes your search fast and convenient, helping to speed up troubleshooting. For example, you can specifically query the database for calls with poor quality, only WebRTC calls, and so forth. From the three dots menu, you can also:
When you've chosen the tenant and date range for which you want to view calls, a progress bar appears to show you where you are in the loading process. |
| 2 - Call List Filter |
This section lets you filter the call list. It contains the following elements: Free Text Search: You can use a free text search to find specific contact IDs or a range of contact IDs that contain a specific number. You can also use it to search for other data that is part of the selected columns, such as agent name, POC Filter: You can filter the call list based on criteria you define. You can filter by a variety of details like media type Columns Selector: You can select the columns of data that appear about calls in the call list. Seven columns display by default, but you can display up to 46 in total. |
| 3 - Summary Tiles |
Shows the quality of voice calls, including MOS, average packet loss, and jitter. It displays a pie chart that shows the breakdown of call quality based on the MOS value. It also shows the distribution tile for call directions data. This includes, DefaultOutbound, AgentLegDefault, InboundPOC, and BlindXfer. If any tiles have an arrow, you can click this arrow to filter the call list according to the options presented. For example, you can choose to display only calls with excellent, good, moderate, or poor quality. |
| 4 - Call List & Contact Records |
Lists every call record within your filter or search parameters. From this list, you can expand each row to view more in-depth information. The information is organized into three tabs, Call Details, Quality Details, and Associated Contacts. It also provides quick access buttons. Each contact record displays a variety of information about the calls, including:
You can also copy content across the grid and each of the tabs. You can either highlight text and copy, or you can use the copy icon for some data fields containing large amounts of text.
If you hover over any contact IDs in these tabs, a pop-up displays links that correlate with the quick access buttons, explained in the following table row. |
| 5 - Quick Access Buttons |
|
 Pin specific contact records in the call list. This lets you quickly access the record while handling or troubleshooting multiple calls.
  Quickly access
  Quickly access the call recording for the contact record you expanded. The recording opens in a recording visualizer page. This displays each person's speaking time, a waveform of the audio, and allows you to skip around the recording. You must have call recording enabled to use this page.
 An interactive page displaying all