Required role: Supervisor, Manager
Refresh rate: Most metrics refresh anywhere from 7 to 9 minutes, depending on the metric. Some metrics refresh as often as every 30 seconds.*
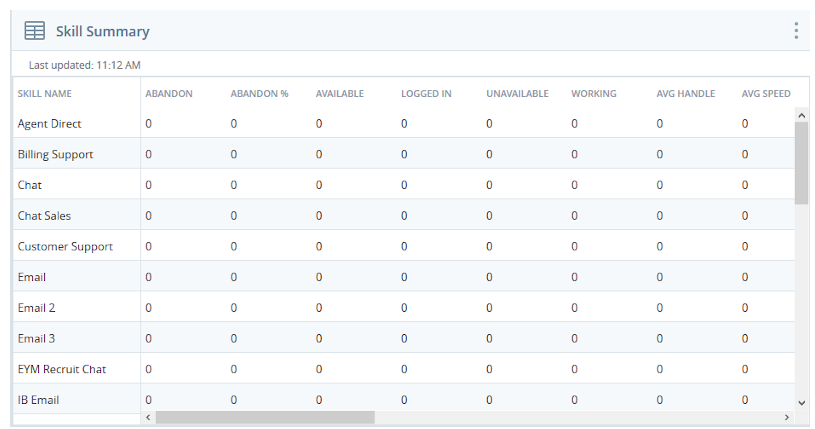
The Skill Summary widget displays current metrics about each selected ACD skill. You can customize the widget to display only certain columns and skills, as well as whether to show data from the last 30 minutes or all data from the current day starting at 12:00 AM. If a skill has 0 contacts within the time period selected, the Service Level will be 0%.

Columns
| Metric | Details |
|---|---|
The name of the skill represented in the row or rows, if you choose to view time intervals. | |
The total number of contacts who hung up before speaking with an agent during the specified time period. | |
The percentage of all contacts in this skill who hung up before speaking with an agent during the specified time period. | |
The number of agents assigned the skill who are logged in and in an available state. | |
The number of agents assigned the skill who are currently logged in. | |
The number of agents assigned the skill who are logged in and in an unavailable state. | |
The number of agents assigned the skill who are currently logged in and actively using the skill. | |
The average amount of time agents spent working on each call in this skill during the specified time period. This includes talk time, dispositions, and hold time. | |
The average amount of time it took agents to answer calls in this skill during the specified time period. | |
The average amount of time agents spent talking to each contact in this skill during the specified time period. | |
The average amount of time agents spent doing after call work, such as applying dispositions, after calls in this skill during the specified time period. | |
The total number of contacts agents handled via this skill during the specified time period. | |
The total number of contacts agents were offered via this skill during the specified time period. | |
The total number contacts placed in this skill's queue during the specified time period. | |
The amount of time contacts spent on hold with an agent in this skill during the specified time period. | |
The number of contacts that agents handled within the defined service level threshold during the specified time period. | |
The greatest amount of time a contact spent in the skill's queue in the specified time period. | |
The number of contacts that agents handled outside the defined service level threshold during the specified time period. | |
The current number of contacts currently in the skill's queue, waiting to converse with an agent. | |
The percentage of total contacts the system offered to agents via the skill that the agents handled within the defined service level threshold during the specified time period. |
*These metrics update every 30 seconds. Users may have the refresh rate throttled back to 7 to 9 minutes for all metrics with heavy use of the widget.
Settings
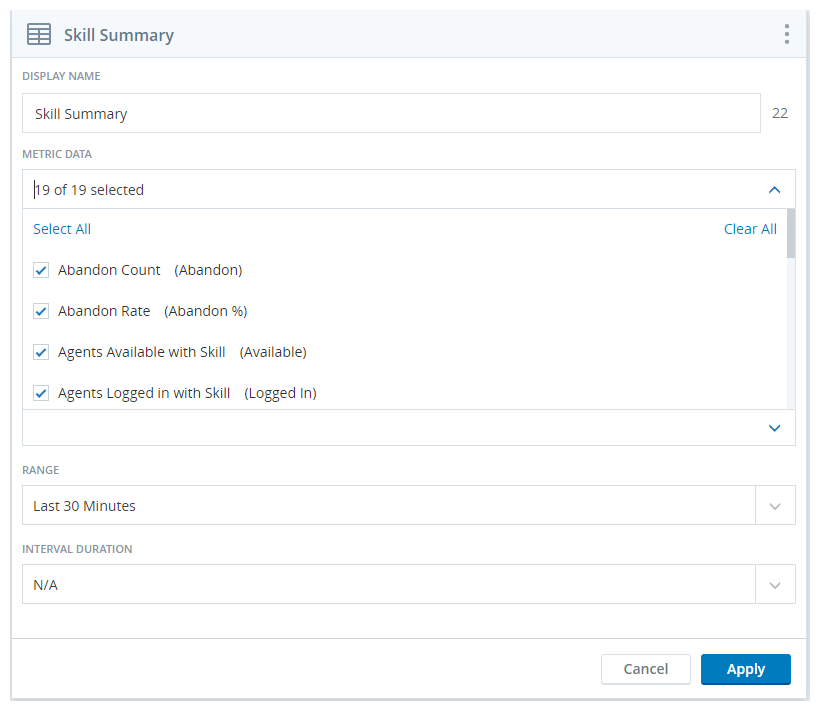
You can customize the information that appears in the Skill Summary widget using the Metric Data drop-down in the Settings window.

Settings containing checkbox selections have a Select All and Deselect All option. These can be used to quickly pick and choose just the metrics needed to create a targeted display. The Agents and ACD Skills settings also have a search box for locating a specific agent or skill.
| Field | Description |
|---|---|
| Display Name | Allows for customization of the widget name |
| Metric Data | Determines which columns show up in the widget |
| Campaigns | Configures which campaign(s) are included in the widget |
| ACD Skills | Configures which skills(s) are included in the widget |
| Media Types | Configures which media types (channels) are included in the service level calculations |
| Range | Sets the widget to display data for the current day or for the last 30 minutes |
| Interval Duration | Determines the interval that the widget uses when the range is set to display data for the current day |
Because this widget contains metrics that are applicable to both real-time and historical widgets, Interval View cannot display real-time metrics in past intervals. For those metrics, the widget displays the data in the most recent interval and a dash ( - ) for past intervals. The widget also displays a dash ( - ) to represent that no data exists for the metric.
The Range setting determines how far back in history you wish to see the data. The options are to view the data for the Last 30 Minutes or view the data for the Current day starting at 12 AM (midnight), based on your
The Interval Duration setting works with the Range setting to provide a view containing rows or layers of data. The Interval Duration setting options are 15 Minutes, 30 Minutes, and 60 Minutes. The 60 Minutes option is only available when you choose Current day starting at 12 AM for the Range setting. The Interval Duration setting is optional and is disabled by default. The widget only displays the current and past intervals. It does not displays future intervals.
For example, if the Range value is set to Last 30 Minutes and the Interval Duration is set to 15 Minutes, then the result would be three layers of data. The top layer would be a set of skills based on the current, real-time data; the next layer would be a set of skills based on data from 15 minutes ago, and the bottom layer would be a set of skills based on data from 30 minutes ago.
Thresholds
You can configure thresholds for some metrics. When a threshold is set for a specific range or time, the skill box for that metric changes color when the value exceeds those parameters.
In managing a team of agents for The Jungle, a subsidiary of Classics, Inc., Jim notices that a lot of abandoned calls. He wants to see if they are associated with specific skills. He opens Legacy Dashboard to look at his Skill Summary widget. Jim sets the Abandon Count threshold from 10 to 99999. This means that if a particular skill goes above nine abandons, the skill box turns orange.
There are three ways to set thresholds for metrics:
To From — Displays an alert when the metric count is above a certain number. The range is from 1 to 99999.
Slider — Displays an orange alert when the metric goes above the first slider value and a red alert when the metric goes above the second slider value. The range is 0 to 100.
Time Range — Displays an alert when the metric goes beyond the specified time. The range is 0 days and 00:00:00 minutes to 10 days and 23:45:00.
This feature is configurable at a user level and threshold settings can't be shared between users.

