
Node Watch
Node Watch is a centralized dashboard that gives Admins and Supervisors a single, consolidated view of the Desktop Discovery Client’s health status for a tenant. You can search for an agent in the Search agents field.
Prerequisites
-
To access the Node Watch feature, the Desktop Discovery application must be enabled on the CXone tenant. Refer to Manage Tenants to enable the NiCE CXone applications.
-
You must select Desktop Discovery from the list of applications, turn the toggle switch on, and then select Desktop Discovery Advanced from the features list.
-
To manage Node Watch, users with View permission can view the dashboard. For agents and other users, refer to Permissions.
If you cannot see the application on your tenant, contact the NiCE support team.
Access Node Watch
Go to Workforce Engagement > Desktop Discovery > Client Management > Node Watch.
If the tenant has no Desktop Discovery clients, the Node Watch page displays no data.
 View image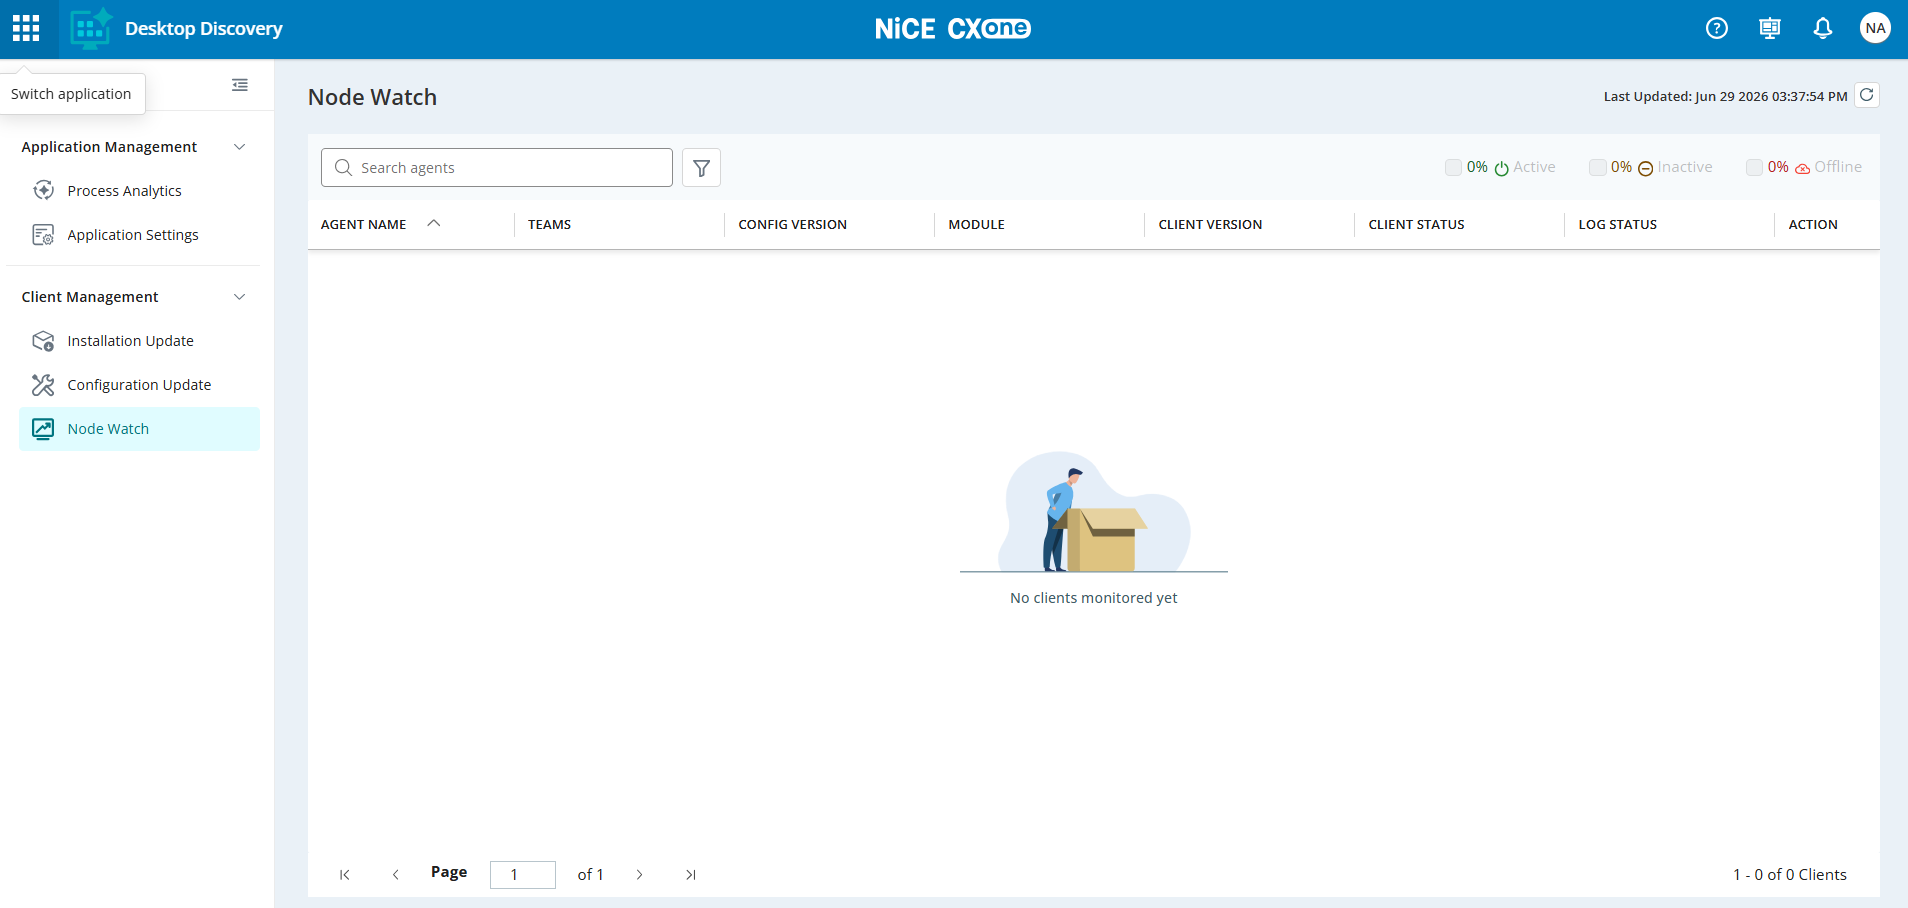
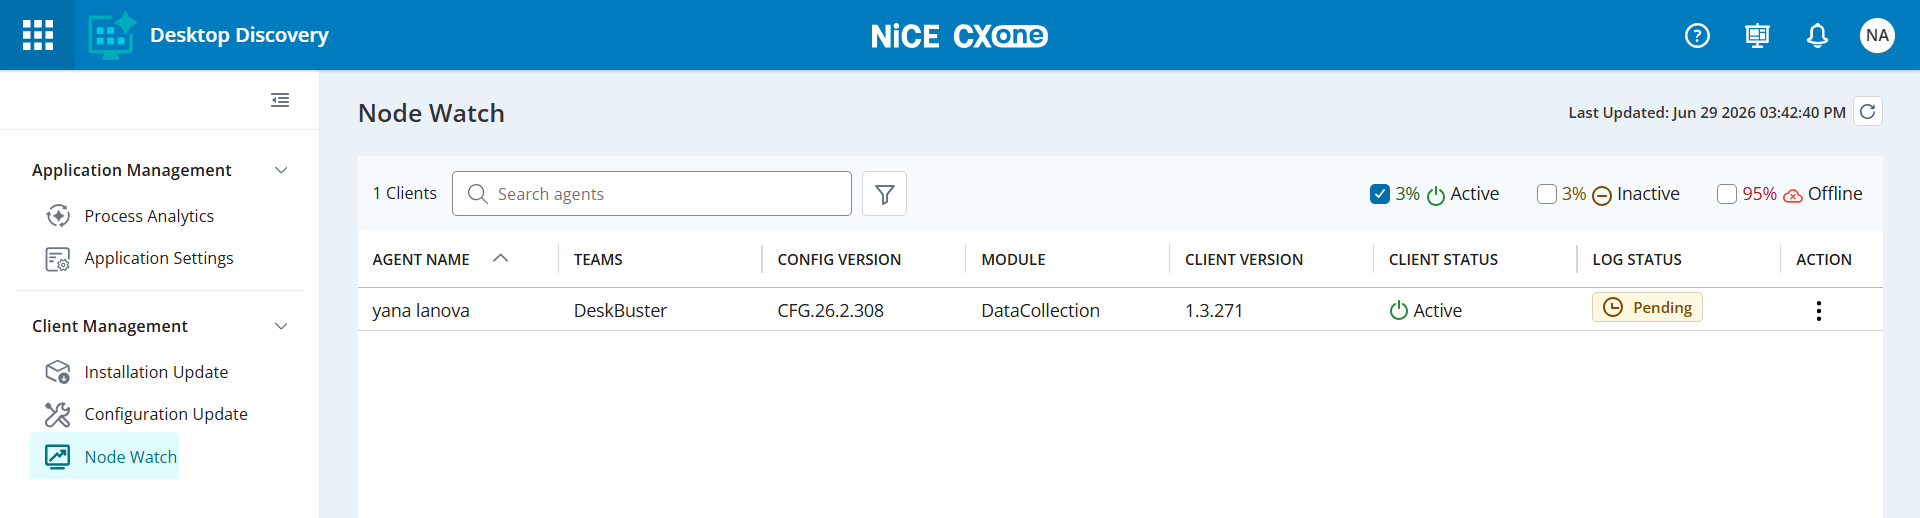
To get the latest Node Watch data, click the Refresh icon ( ) at the top-right corner of the page. When the tenant has one or more Desktop Discovery clients, the Node Watch page automatically displays the pre-populated agent information reflecting the current state of the Desktop Discovery Client.
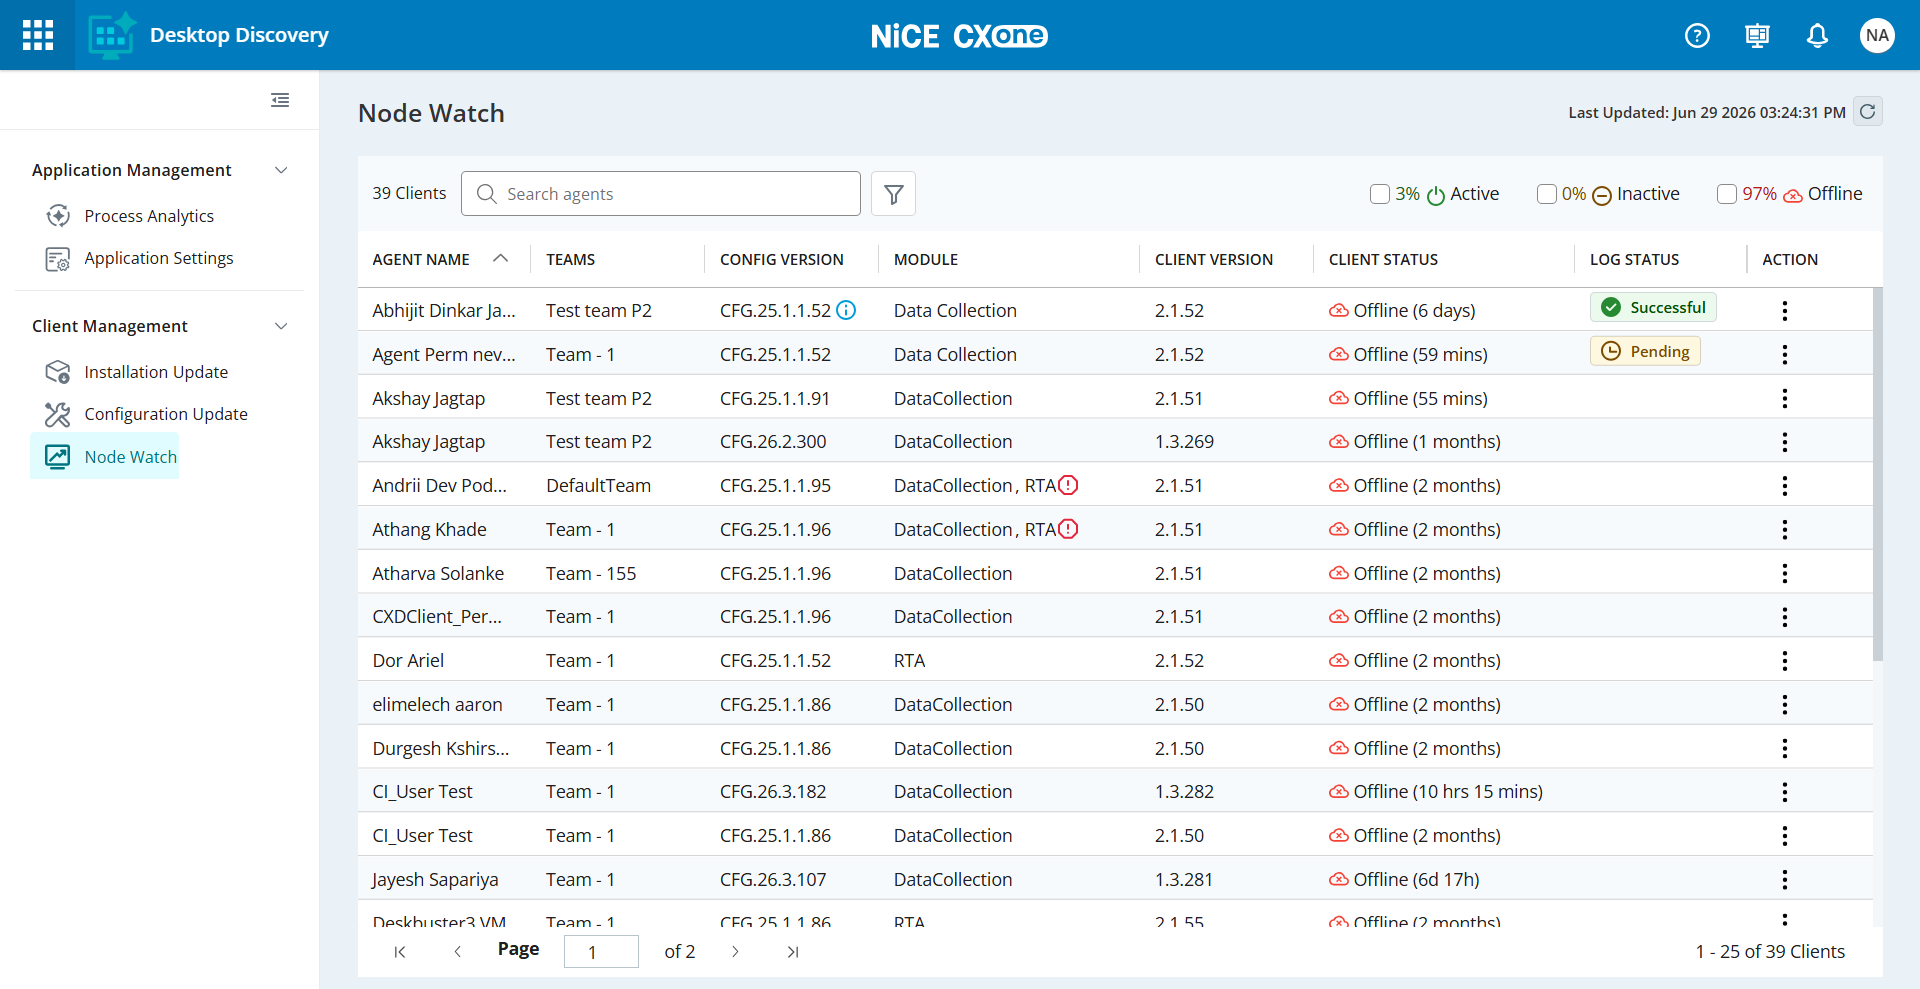
The Node Watch page displays the following information:
|
Column |
Details |
|---|---|
|
Agent Name |
The name of the agent. |
| Teams |
The team name to which the agent belongs. |
| Config Version | The configuration version assigned to the agent. |
| Module | The modules assigned to the agent. |
| Client Version | The client version assigned to the agent. |
| Client Status |
The current status of the client. The following options are available:
When the agent is Inactive or Offline, the system displays the duration since the agent was last active. |
| Log Status |
The current status of the log configuration. The following options are available:
|
| Action |
The following actions can be performed:
|
Apply Filters
You can apply filters to display the required data.
-
Go to Workforce Engagement > Desktop Discovery> Client Management > Node Watch.
-
Click the filter
 icon.
icon. -
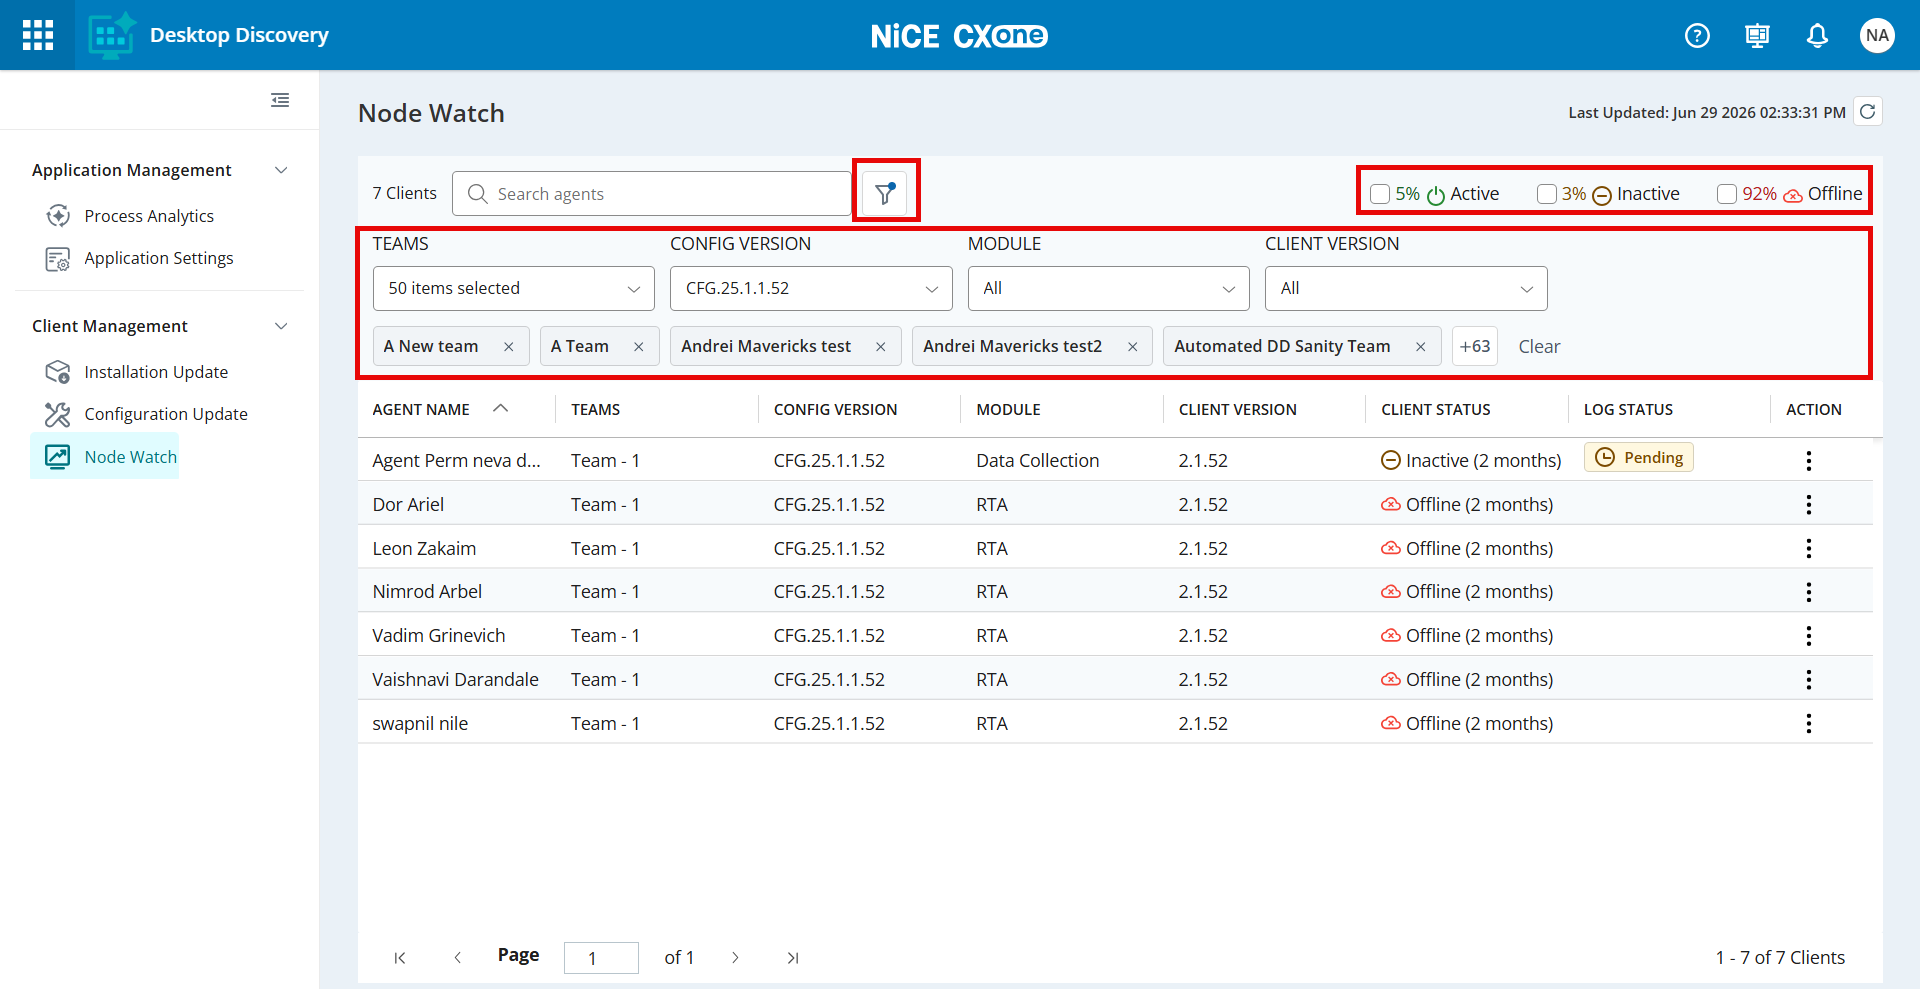
Apply the following filters to display results:
-
Teams: Open the Teams dropdown and select one or more team options.
-
Config Version: Open the Config Version dropdown and select one or more config version options.
-
Module: Open the Module dropdown and select one or more module options.
-
Client Version: Open the Client Version dropdown and select one or more client version options.
-
-
Select the required check boxes to view data based on Client Status. The following options are available:
-
Active
-
Inactive
-
Offline
-
Log Configurations
Administrators and Supervisors can remotely adjust log levels for Desktop Discovery agents directly from the Node Watch. This feature allows real-time troubleshooting and log configuration updates without requiring manual intervention on individual agent machines. Log configuration is supported for agents in active and inactive states, but is not available for agents in an offline state.
-
Go to Workforce Engagement > Desktop Discovery > Client Management > Node Watch.
-
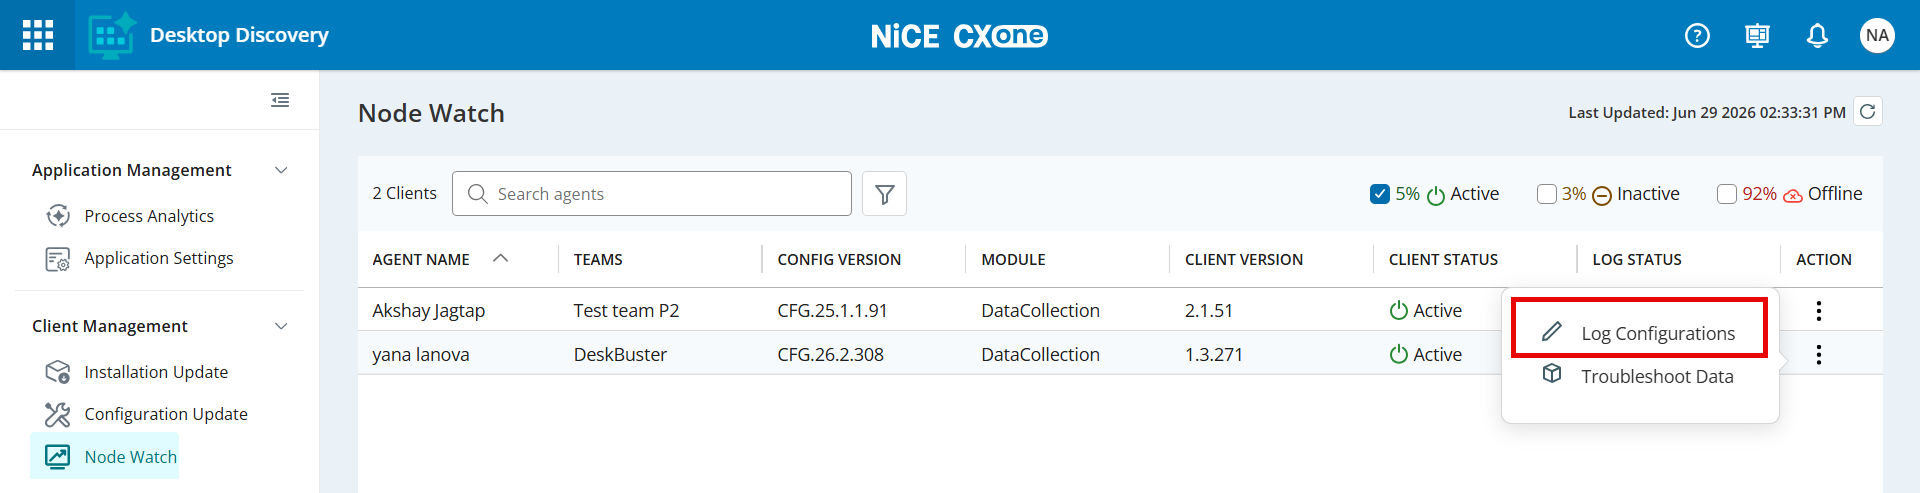
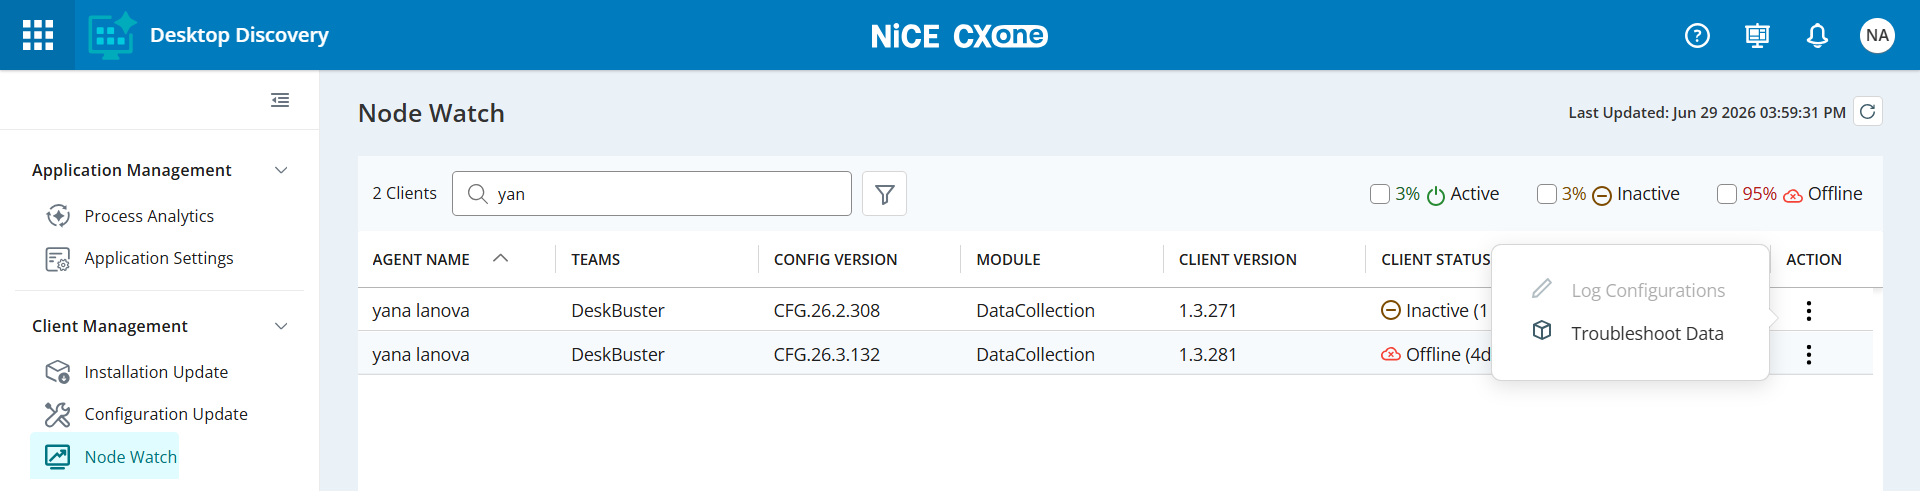
In the Actions tab, click
 icon next to the agent name.
 -
Click Log Configurations.
-
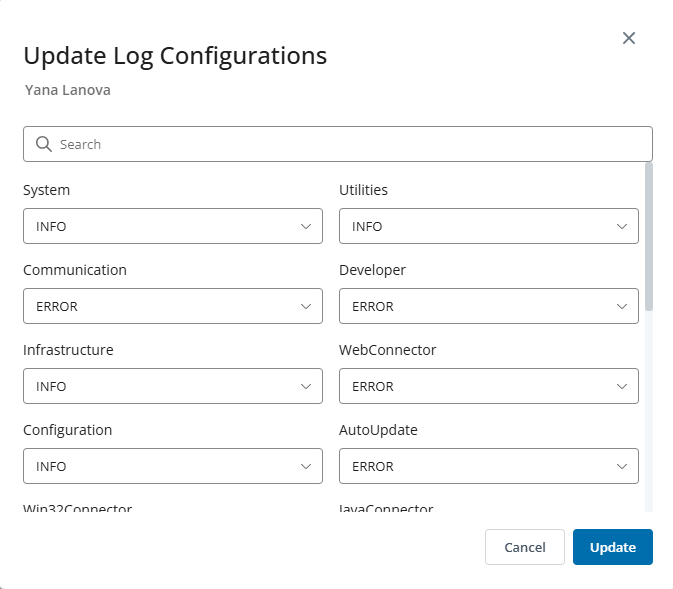
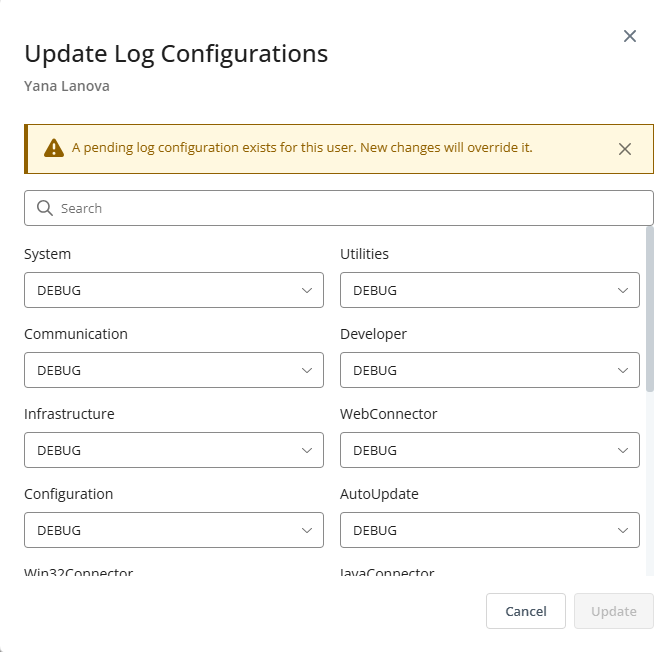
In the Update Log Configurations dialog, you can do the following:
-
Search for a specific log level.
-
Update any log level by selecting an option from the available options for the agent.
-
-
Click Update. The Update button becomes active only after a log level is changed.
-
After the log configuration is updated, its status moves to Pending.
If you select an agent with a Pending status, the following message appears:
-
When the client becomes active and picks up the job for execution, the status changes from Pending to In-Progress.
For agents with an In-Progress status, the Log Configuration option is disabled.
-
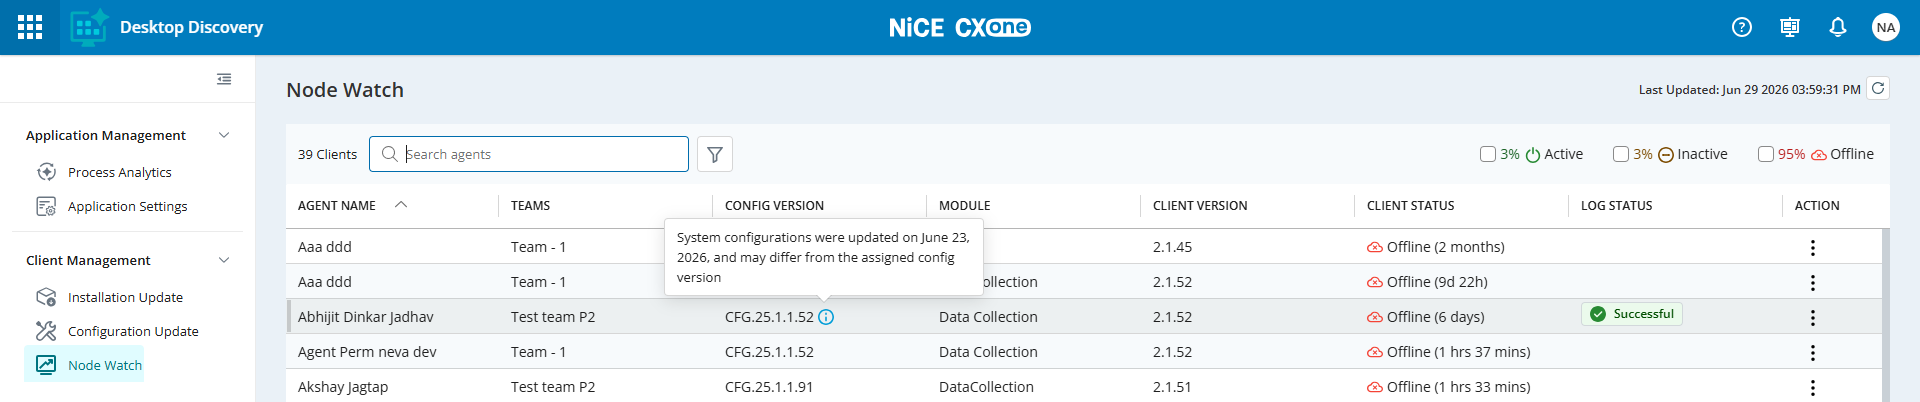
Upon completion, the status is updated to either Success or Failure. When the log status is Successful, the Config Version field displays a tooltip next to the agent indicating that the system configurations were updated and may differ from the assigned configuration version.
-
Troubleshoot Data
Administrators and Supervisors can view and download troubleshooting logs for Desktop Discovery agents directly from the Node Watch. This feature provides immediate access to client logs securely stored in S3, enabling faster issue investigation and reducing manual intervention from the end user.
-
Go to Workforce Engagement > Desktop Discovery > Client Management > Node Watch.
-
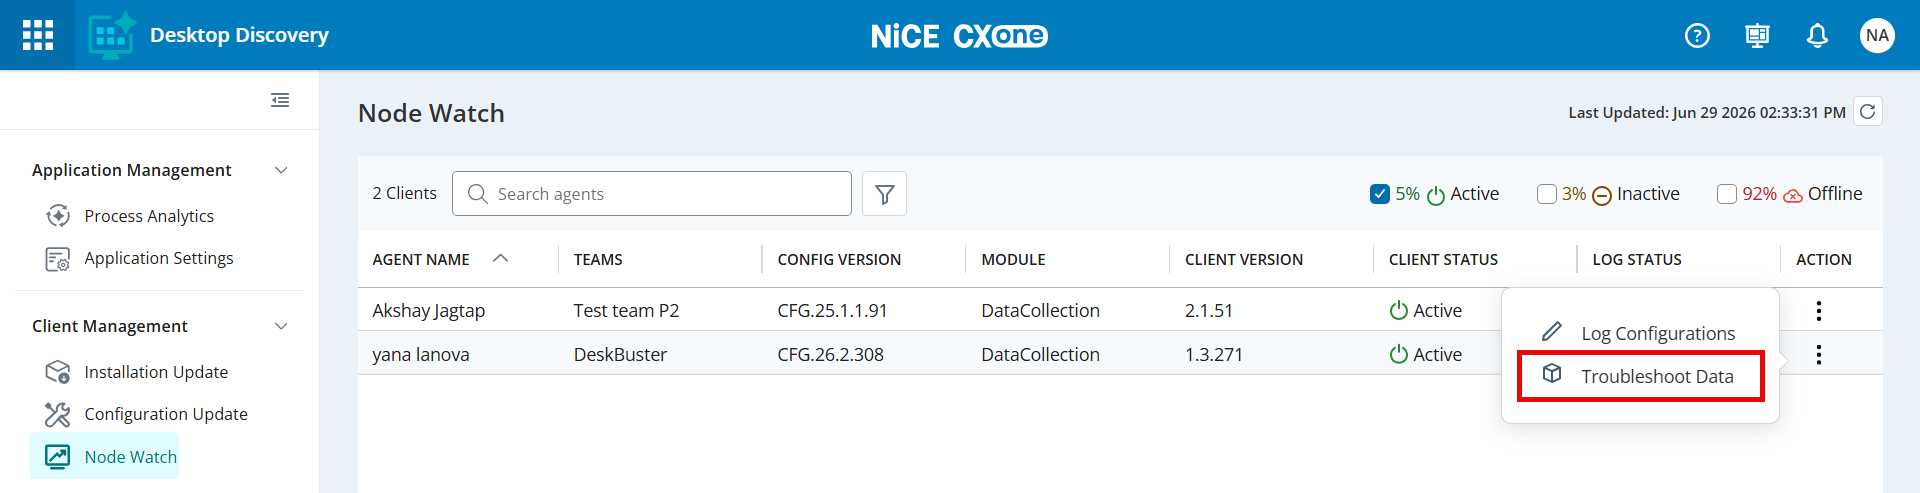
In the Actions tab, click
icon next to the agent name. -
Click Troubleshoot Data.
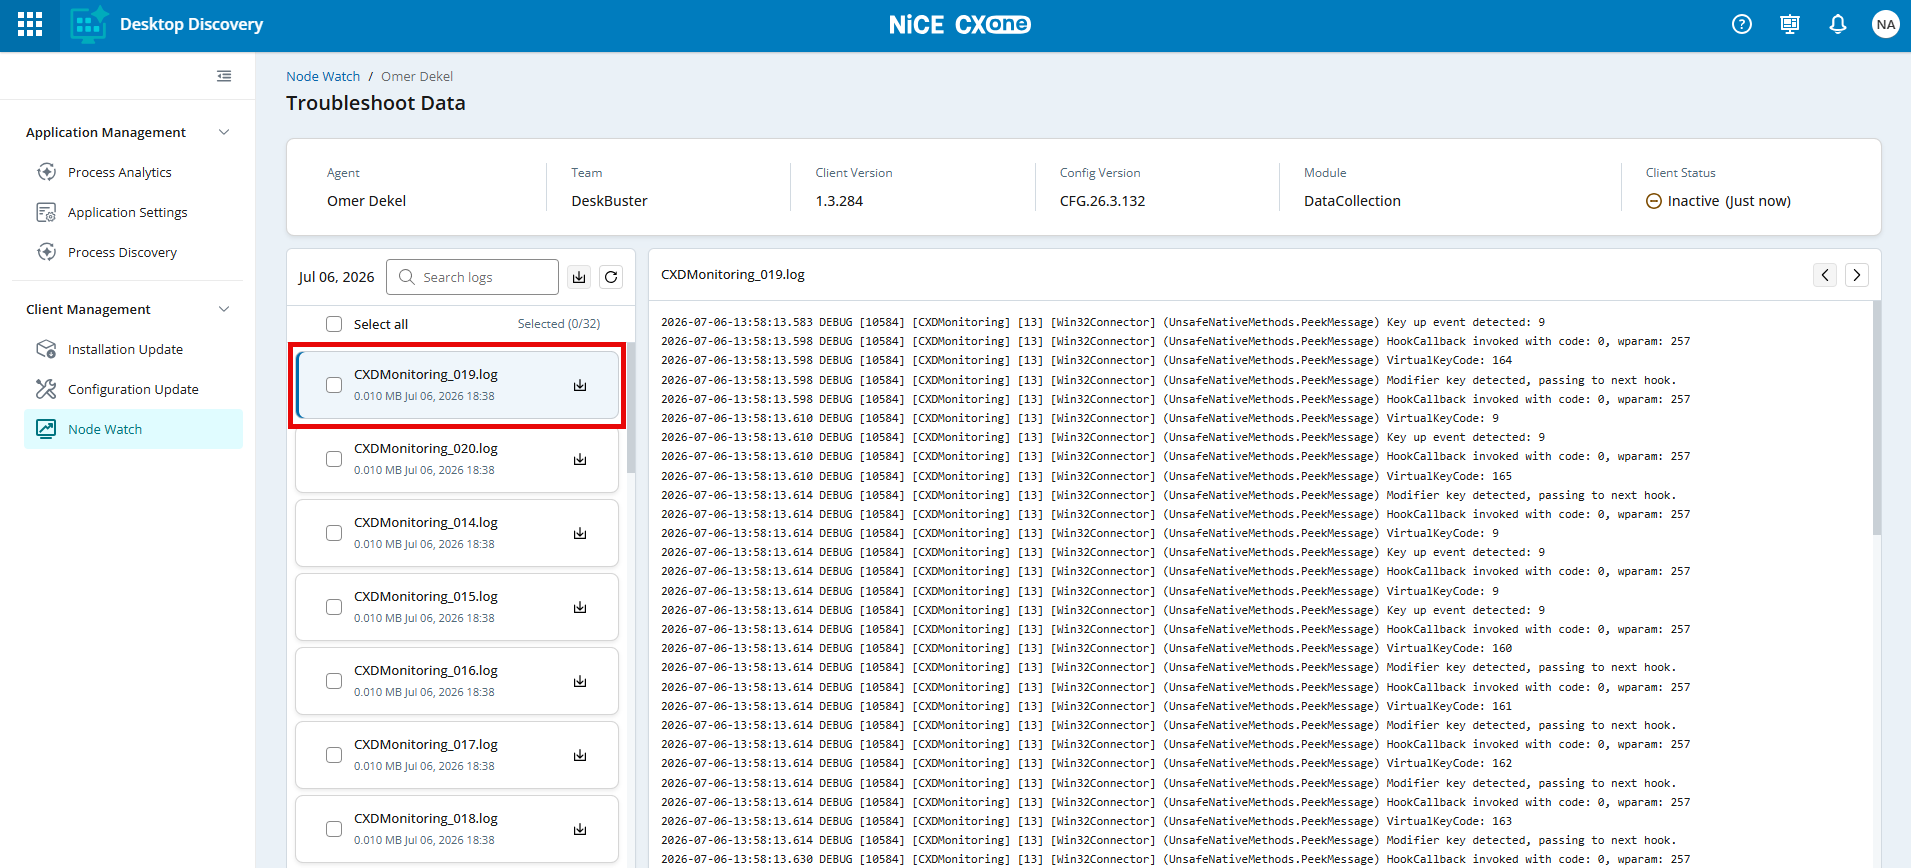
On the Troubleshoot Data page, you can do the following:
-
View log file contents
-
Download one or more log files
-
Search for specific log files using the Search logs field
-
Click the Refresh icon to retrieve the latest log files for the agent
-
-
To view log data, click the required log file in the left pane. The contents of the selected log file are displayed in the right pane.
-
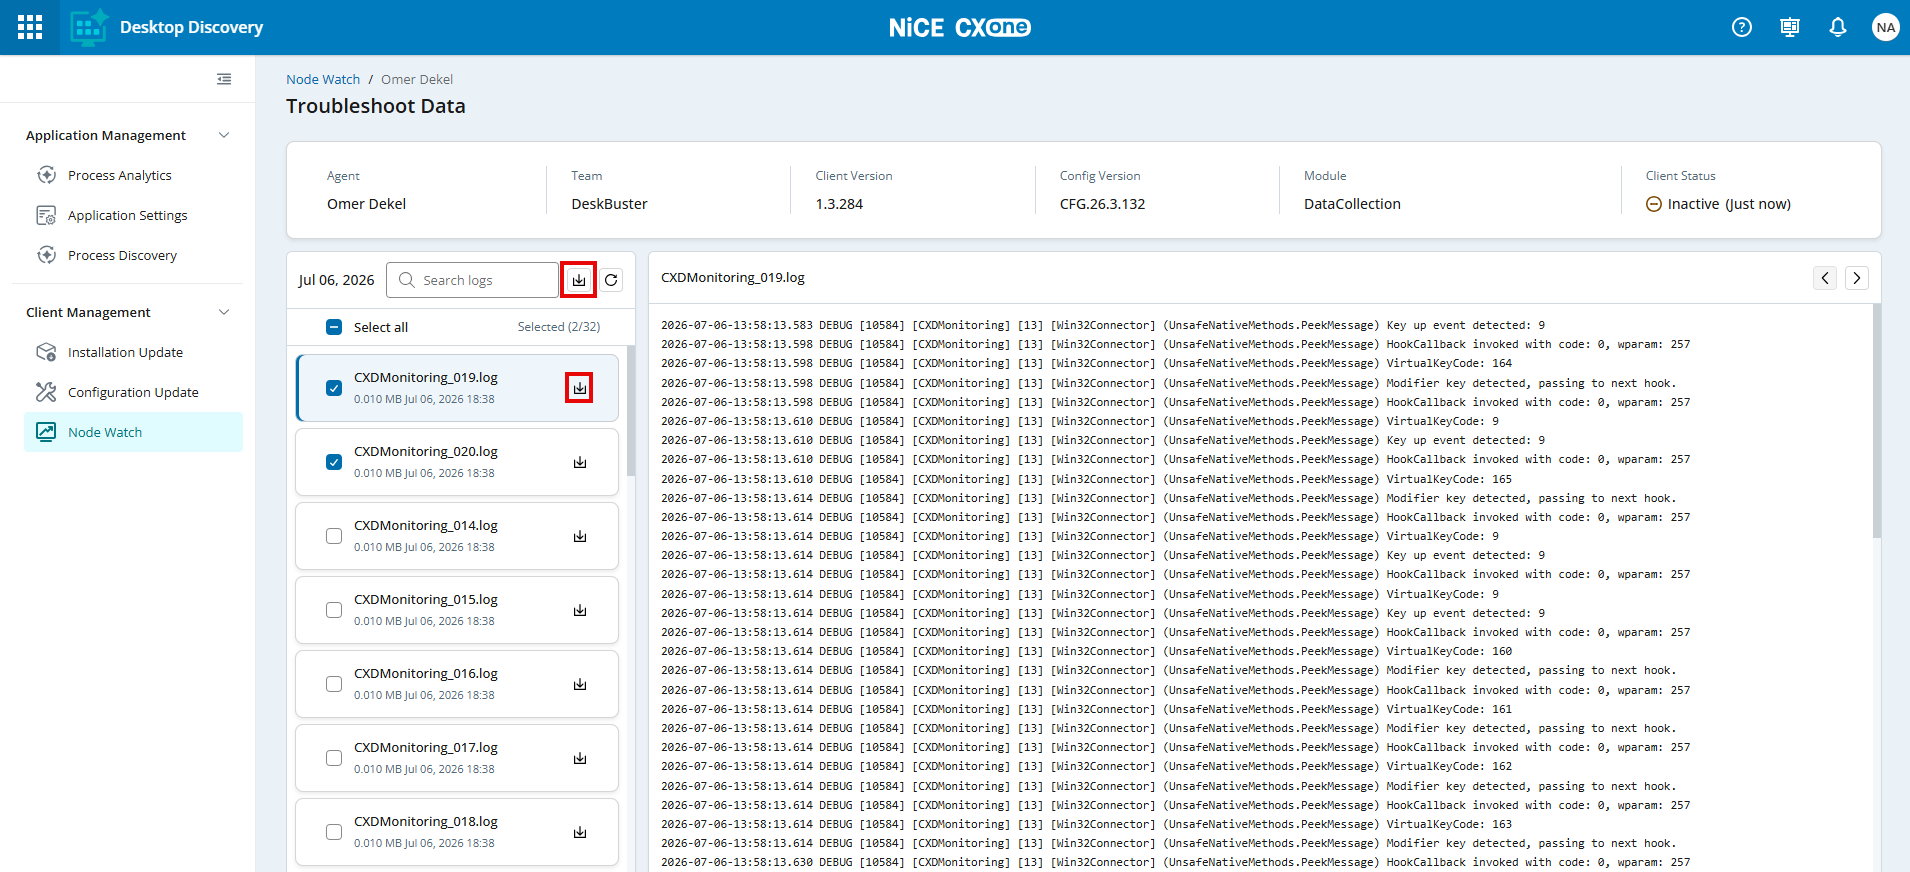
To download a log file, click the Download icon (
 ) next to the required file. The file is downloaded to your system.
 -
To download multiple log files, select the check boxes next to the required file names, then click the Download icon (
) next to the search field. The selected files are downloaded as a .zip file.A maximum of 100 log files can be downloaded at one time.