

ACD widgets give you an overview of the contact center's performance. Each ACD widget provides specific data about a certain functionality in your contact center. You can drag and drop the widgets or double-click on the widget to add them to your dashboard. You can also use the settings to add your filters to see the data. They offer a quick view of real-time contact center data as it is collected.
You cannot see these widgets if your NiCE CXone applications do not include ACD.
Organizations with a NiCE CXone Performance Management (Native) license can access up to 95 days of historical data within a 25-month lookback period. Those with a dashboard-only license are limited to same-day data.
You can take a short eLearning that gives an overview of Dashboard and ACD Widgets. This course explores the different ACD Widgets and the widget settings you can use for your dashboards.
Agent Contact View
Data refresh rate: 7-10 seconds
Widget refresh rate: 7 seconds
Duration support: Near real-time
This widget displays real-time information about agent states![]() The availability status of an agent., highlighting After Call Work (ACW) and Unavailable time. It shows each agent’s current state, the time spent in ACW or Unavailable, and other relevant state details for the current day.
The availability status of an agent., highlighting After Call Work (ACW) and Unavailable time. It shows each agent’s current state, the time spent in ACW or Unavailable, and other relevant state details for the current day.
You must have these permissions:
-
ACD > ACD Dashboard Widgets > Agent List: On
-
Dashboard > Dashboards: View
-
Dashboard > Dashboards: Edit (optional)
If you cannot access the widgets or Dashboard, check with your administrator. The administrator can find these permissions in NiCE CXone. Go to Admin > Security Settings > Roles and Permissions and select the role.
You can customize the columns:
Click Options  , then Columns to select the columns you want to see.
Available columns are: Agent Name, Contact No, Skill, Channel, Agent Contact State, Agent Contact State Time.
The Agent Name and Agent Contact State columns are mandatory and cannot be hidden.
-
Click
 to auto size a specific column or all the columns.
 -
Click
 to select filter options.
 -
Click
 to select the columns you want to see on the widget.
You can personalize your column settings by adjusting the column size, sort, filter, and arrange, then save these changes.
You can sort the columns on the widget. To do a secondary sort of the columns, hold down Shift while sorting.
Agent State Counter
Data refresh rate: 7-10 seconds
Widget refresh rate: 7 seconds
Duration support: Near real-time
This widget gives an overview of all the different states![]() The availability status of an agent. that the signed-in agents are currently in, and the number of agents in each state for the current day. It also provides details on the total number of agents signed in to the application.
The availability status of an agent. that the signed-in agents are currently in, and the number of agents in each state for the current day. It also provides details on the total number of agents signed in to the application.
By default, the widget opens in Chart view. Click Options , then Widget Display to change the view to Table, or Table and Chart side by side.
You must have these permissions:
-
ACD > ACD Dashboard Widgets > Agent State Counter: On
-
Dashboard > Dashboards: View
-
Dashboard > Dashboards: Edit (optional)
If you cannot access the widgets or Dashboard, check with your administrator. The administrator can find these permissions in NiCE CXone. Go to Admin > Security Settings > Roles and Permissions and select the role.
The percentage of agents in each state is displayed when you hover over the state colors in the pie chart. The agent state colors are:
| Color | State |
|---|---|

|
Number of agents in the Available state and prepared to handle contacts. |

|
Number of agents in the Working Contacts & Dialer state. This includes agents actively handling a contact and also agents in an ACW |

|
Number of agents in a Logged Out state. |

|
Number of agents in an Unavailable state. |

|
Number of agents in the Available & Dialer state. |

|
Number of agents in the Working Contacts state. This includes agents actively handling a contact and also agents in an ACW |
Click Options , then Settings on the widget to filter the data you want to see.
Field descriptions
-
Display Name: Define a name for the widget.
-
Team: Select the teams to include in the widget. Only the agents from the teams you select are displayed.
-
Agent: Select the agents to include in the widget from your selected teams in the Teams filter.
-
Campaign: Select the campaign that you want to include in the widget.
-
Skill: Select the agent skills
 Used to automate delivery of interactions based on agent skills, abilities, and knowledge. to include in the widget. Only the agents skilled in one of the selected filters are considered.
Agent List
Data refresh rate: 7-10 seconds
Widget refresh rate: 7 seconds
Duration support: Near real-time
This widget lets you keep track of your agents' current state![]() The availability status of an agent. and their active session information. The Agent List widget organizes the list of agents, grouping those with similar states together. You can view the list of agent states for the selected day, along with a summary of the total time spent in each state.
The availability status of an agent. and their active session information. The Agent List widget organizes the list of agents, grouping those with similar states together. You can view the list of agent states for the selected day, along with a summary of the total time spent in each state.
Click Expand  to view the Skill, Channel, Agent Contact State, Agent Contact Time and Contact Number.
Use the Expand All Row Groups and Collapse All Row Groups options in the column header to quickly adjust the view of agent contact groups.
-
Expand All opens only groups with agents in targeted states (such as Working Contacts & Dialer, Unavailable, or Custom Unavailable).
-
Collapse All closes all groups, no matter their state or if they were manually expanded. You can still expand or collapse individual groups manually at any time.
-
You can sort or filter based on agent states. For example, you can filter the agent list to see all the agents in a logged out state and for how long they have been in that state.
-
If the widget is sorted by any of its columns and you want to group all agents with similar states in the widget, ensure no column sorting is applied. Click the column header repeatedly until the sorting is removed.
-
On Widget Display, you can display the data in your widget as a Table, Chart, or Table and Chart.
-
As a viewer, changes you make to the table display of the widget are saved to your personal settings. However, if the dashboard owners make changes to the dashboard after you have saved your modifications, their changes will override your personal settings.
You must have these permissions:
-
ACD > ACD Dashboard Widgets > Agent List: On
-
Dashboard > Dashboards: View
-
Dashboard > Dashboards: Edit (optional)
If you cannot access the widgets or Dashboard, check with your administrator. The administrator can find these permissions in NiCE CXone. Go to Admin > Security Settings > Roles and Permissions and select the role.
Click Options next to the agent's name to view Agent State Details and Give Reward options.
You need to have the Agent Zoom permission enabled in Dashboard to view the agent state details.
Click Options next to the agent's name to view the summary of the different states of a specific agent.
You can then select Agent State Details, which displays the agent's State in different colors, the Start Time, Duration, and Skill. This helps you to zoom into the agent's state details.
-
The Summary in the Agent State Details displays an agent’s state distribution. It includes a bar chart and percentages for different states. Each category is color-coded and shows the total aggregated time (in hours, minutes, and seconds) in each state throughout the session.
-
The Detailed view displays the different states the agent has been in during the agent session, the start time of each state, and the duration spent in each state.
| Color | State |
|---|---|
|
|
Number of agents in the Available state and prepared to handle contacts. |
|
|
Number of agents in the Working Contacts & Dialer state. This includes agents actively handling a contact and also agents in an ACW |
|
|
Number of agents in a Logged Out state. |
|
|
Number of agents in an Unavailable state. |
|
|
Number of agents in the Available & Dialer state. |
|
|
Number of agents in the Working Contacts state. This includes agents actively handling a contact and also agents in an ACW |
The refresh rate for agent zoom is 5 to 10 minutes after the agent's state ends.
Agent state details are available only when the agent is in the Working Contacts and Working Contacts & Dialer state.
An Agent Contact State is a short label that represents a specific stage or action completed by an agent during a customer interaction.
|
Agent Contact State Name |
description |
|---|---|
| Created | The contact session has just been created. |
| ACW | The agent is completing after-call work. |
| ACW Paused | The agent has paused their after-call work. |
| Ended | The contact session has ended. |
| Transfer | The contact is being transferred to another agent or queue. |
| Focused | The agent is actively focused on the contact. |
| Unfocused | The agent is not currently focused on the contact. |
| Active | The agent is actively handling the contact. |
| Outbound | The agent is making an outbound contact. |
| Hold | The contact is on hold. |
| Inqueue | The contact is waiting in the queue. |
| Interrupted | The contact was interrupted, possibly by another task. |
| Busy | The agent is currently busy with a contact. |
| Conference | The contact is part of a conference session. |
| CallBack | A callback has been scheduled for the contact. |
| PlaceCall | The agent is placing a call to the contact. |
| EmailDiscard | The email contact was discarded. |
| EmailReply | The agent is replying to an email contact. |
| EmailForward | The email contact is being forwarded. |
| EmailTransfer | The email contact is being transferred. |
| CallbackPending | A callback is pending for this contact. |
| Refused | The contact was refused or not accepted. |
| PauseDetection | The system is detecting a pause in the contact. |
| Answered | The contact has been answered. |
| Parked | The contact is parked and waiting. |
| InQueuePreview | The contact is in preview mode before being handled. |
| Abandoned | The contact was abandoned before being handled. |
| Unspecified | The contact state is not specified. |
| Preview | The agent is previewing the contact before engagement. |
| Preview-Unfocused | The agent previewed the contact but is not focused. |
| Connecting | The system is connecting the contact. |
| Active | The agent is actively working on the contact. |
| Contact Work-Unfocused | The agent is working on the contact but not focused. |
| Hold | The contact is on hold while the agent works. |
| Hold-Unfocused | The contact is on hold and the agent is not focused. |
| Conference | The agent is in a conference while working on the contact. |
| Conference - Unfocused | The agent is in a conference but not focused on the contact. |
| ACW | The agent is completing post-contact tasks. |
| ACW-Unfocused | The agent is doing post-contact work but not focused. |
| Ended | The contact session has fully ended. |
This feature is only available for organizations with the PM license and the Gamification > Give Award permission enabled.
The Give Award feature allows managers or supervisors to recognize and reward employees by giving them performance-based incentives or awards in the form of coins.
To use Give Award:
-
Click Options
next to the agent's name and then click Give Award. -
The Give Award window displays the name of the selected agent receiving the award at the top. You can also search for specific awards by name.
-
The available awards are displayed in a card-based layout, organized into folders. Each award card shows the award's name, a badge or icon, and the number of coins associated with that award.
-
The awards shown in the dialog box are based on your Give Award permission level and the selected receiving agent's team assignments.
-
If you have the Give Award permission, it will include all awards assigned to the selected agent or their team.
-
When you select an award to give, the coins are deducted from the budget and added to the receiving agent's balance when the award is given.
-
When an agent receives an award, they are informed through notification and an email, of the award they received.
Using the Widget Display, you can choose from Table, Chart, or Table and Chart options.
Click Options, then Settings on the widget to filter the data you want to see.
Field descriptions
-
Display Name: Define a name for the widget.
- Show logged in agents: Select to see only the agents who are logged in.
-
Show logged out agents: Select to see only the agents who are logged out.
-
Team: Select the teams to include in the widget. Only the agents from the teams you select are displayed.
-
Agent: Select the agents to include in the widget from your selected teams in the Teams filter.
-
Campaign: Select the campaign that you want to include in the widget.
-
Skill: Select the agent skills
Used to automate delivery of interactions based on agent skills, abilities, and knowledge. to include in the widget. Only the agents skilled in one of the selected filters are considered.
You can customize the columns:
You can select from a range of columns to display that include, Agent Name, Team Name, Agent State, Skill Name, Time In State, and Session Time.
-
Click
to auto size a specific column or all the columns. -
Click
to select filter options. -
Click
to select the columns you want to see on the widget.
You can personalize your column settings by adjusting the column size, sort, filter, and arrange, then save these changes.
You can sort the columns on the widget. To do a secondary sort of the columns, hold down Shift while sorting.
Agent State Summary
Data refresh rate: 5-10 minutes after the agent's state ends
Widget refresh rate: 5 minutes
Duration support: Historical - 90 days
This widget shows the different states of an agent for a selected duration, along with the percentage and duration of time the agent has spent in each state. The total at the bottom displays the total duration of time in each state and the sum of the percentages of the states. You can also view the percentage and total duration of time agents spend in each unavailable state, such as break, lunch, or meeting.
You must have these permissions:
-
ACD > ACD Dashboard Widgets > Agent State Summary: On
-
Dashboard > Dashboards: View
-
Dashboard > Dashboards: Edit (optional)
If you cannot access the widgets or Dashboard, check with your administrator. The administrator can find these permissions in NiCE CXone. Go to Admin > Security Settings > Roles and Permissions and select the role.
The Agent State Summary widget is visible to users with Agent State Summary or Unavailable Statistics widget permissions. It's better to use the Agent State Summary. If users have the Unavailable Statistics permission, we recommend switching it to Agent State Summary.
Click Options and then Settings on the widget to filter the data you want to see in each widget.
Field descriptions
-
Display Name: Define a name for the widget.
-
Show only Unavailable states: Select to view only the unavailable states.
-
Date: Select the date you want to view the agent state summary.
-
Team: Select the teams to include in the widget. Only the agents from the teams you select are displayed.
-
Agent: Select the agents to include in the widget from your selected teams in the Teams filter. Inactive agents are displayed on the dashboard only if the selected date range includes a period when they were active. If the date range includes a period before and after they've become inactive, they will not be displayed.
You can customize the columns:
-
Click
to auto size a specific column or all the columns. -
Click
to select filter options. -
Click
to select the columns you want to see on the widget.
You can personalize your column settings by adjusting the column size, sort, filter, and arrange, then save these changes.
You can sort the columns on the widget. To do a secondary sort of the columns, hold down Shift while sorting.
Supervisors can check why many agents have logged out and for how long they were away. They can then take necessary steps to ensure the capacity of agents handling customers is maintained.
Contact States by Skill
Data refresh rate: 7-10 seconds
Widget refresh rate: 7 seconds
Duration support: Near real-time
The Contacts States by Skill widget shows the status of the contacts currently active in the system, grouped by skills![]() Used to automate delivery of interactions based on agent skills, abilities, and knowledge..
Used to automate delivery of interactions based on agent skills, abilities, and knowledge..
You must have these permissions:
-
ACD > ACD Dashboard Widgets > Contact States by Skill: On
-
Dashboard > Dashboards: View
-
Dashboard > Dashboards: Edit (optional)
If you cannot access the widgets or Dashboard, check with your administrator. The administrator can find these permissions in NiCE CXone. Go to Admin > Security Settings > Roles and Permissions and select the role.
You can see the different states![]() The availability status of an agent. for each skill:
The availability status of an agent. for each skill:
-
InQueue – Represents the contact states where the customer is waiting in a queue for an agent or a system response.
-
With Agent – Represents the contact states where the customer is actively engaged with an agent, including handling, hold, or conference scenarios.
-
PostQueue – Represents contact states occurring after the queue phase, such as transfers or escalations before an agent takes over.
-
PreQueue – Represents contact states before the queue phase, such as IVR interactions and pre-routing actions.
-
OutQueue – Represents contact states related to outbound interactions, including dialing, connecting, or handling outbound calls.
Click Options, then Settings on the widget to filter the data you want to see.
Field descriptions
-
Display Name: Define a name for the widget.
-
Campaign: Select the campaign that you want to include in the widget.
-
Skill: Select the agent skills
Used to automate delivery of interactions based on agent skills, abilities, and knowledge. to include in the widget. -
Channel: Select the channel that you want to include in the widget.
You can customize the columns:
-
Click
to auto size a specific column or all the columns. -
Click
to select filter options. -
Click
to select the columns you want to see on the widget.
You can personalize your column settings by adjusting the column size, sort, filter, and arrangement, and then save these changes, even with the View dashboard permission.
Sorting table columns
You can sort the data in the table by clicking a column header. To apply a secondary sort, hold down the Shift key and click another column header.
-
The primary sort column displays a 1 next to the column title.
-
The secondary sort column displays a 2 next to the column title.
If the number of contacts in queue for a particular skill is high, supervisors can reduce this by increasing the number of agents handling that skill.
Contact List
Data refresh rate: 7-10 seconds
Widget refresh rate: 7 seconds
Duration support: Near real-time
The Contact List widget displays the active contacts in the different states. It also shows the time the contacts have been in that state![]() The availability status of an agent., the skill
The availability status of an agent., the skill![]() Used to automate delivery of interactions based on agent skills, abilities, and knowledge., the agent handling the contact, and the channel
Used to automate delivery of interactions based on agent skills, abilities, and knowledge., the agent handling the contact, and the channel![]() Various voice and digital communication mediums that facilitate customer interactions in a contact center. used.
Various voice and digital communication mediums that facilitate customer interactions in a contact center. used.
-
The widget shows all active contacts (contacts that are not closed).
-
If there are fewer than 10,000 active contacts, the widget shows all of them.
-
If there are more than 10,000 active contacts, the widget shows the most recently updated 10,000 contacts first.
You must have these permissions:
-
ACD > ACD Dashboard Widgets > Contact List: On
-
Dashboard > Dashboards: View
-
Dashboard > Dashboards: Edit (optional)
If you cannot access the widgets or Dashboard, check with your administrator. The administrator can find these permissions in NiCE CXone. Go to Admin > Security Settings > Roles and Permissions and select the role.
When you click on the Contact ID, the contact zoom window displays the different states the contact has been, along with the Start Time and Duration in each state. The contact zoom data refreshes for ongoing contacts within 5 to 7 seconds.
Click Options and then Columns to select the columns you want to show on the widget, like Contact No, State Name, Contact Date, State Time, Contact Time, Agent Name, Skill Name, Campaign Name, Channel, Company#, Customer #, Direction, Interaction Id.
Click Options, then Settings on the widget to filter the data you want to see.
Field descriptions
-
Display Name: Define a name for the widget.
-
Team: Select the teams to include in the widget. Only the agents from the teams you select are displayed.
-
Agent: Select the agents to include in the widget from your selected teams in the Teams filter.
-
Campaign: Select the campaign that you want to include in the widget.
-
Skill: Select the agent skills
Used to automate delivery of interactions based on agent skills, abilities, and knowledge. to include in the widget. -
Point of Contact: Select a point of contact
The entry point that an inbound contact uses to initiate an interaction, such as a phone number or email address. or an entry point the customer has used for the interaction to include in the widget. -
Channel: Select the channel attributes that you want to include in the widget.
-
Contact States: Select the state of the contact to include in the widget.
You can customize the columns:
-
Click
to auto size a specific column or all the columns. -
Click
to select filter options.
You can personalize your column settings by adjusting the column size, sort, filter, and arrange, then save these changes.
You can sort the columns on the widget. To do a secondary sort of the columns, hold down Shift while sorting.
| State | Description |
|---|---|
| Undefined | The contact's status does not match any predefined category. This can occur due to a technical anomaly or incomplete data. |
| Abandoned | The contact ended before an agent answered. |
| Routing | The system is actively determining the best agent or skill |
| Released | Either the agent or the system disconnected the contact after completion. |
| Active | The agent is active with the contact. |
| Transfer | The contact is being transferred from one agent or skill to another. |
| Inbound | The contact originated from outside the contact center. |
| Outbound | The agent or system initiated the contact. |
| Hold | The agent has placed the contact on hold. |
| PreQueue | The contact is in the system before entering a queue. It may be in an IVR or initial routing logic. |
| InQueue | The contact is waiting in a skill queue for an available agent. |
| PostQueue |
The interaction between the agent and the user / patron has been completed but the contact has not been ended yet. This is most commonly used for scenarios such as post-contact surveys. |
| Interrupted | The contact was disrupted. This may be due to system changes, agent disconnects, or transfer interruptions. |
| Busy | The system attempted an outbound call but the line was busy. |
| Conference | The contact has multiple parties connected. |
| CallBack | The contact opted to be called back instead of waiting in a queue. |
| Spawned | The contact was generated from an existing one. For example, a secondary outbound call during an active call. |
| PlaceCall | The agent or system is initiating an outbound call but it is not yet connected. |
| EndContact | The contact has fully ended and is no longer active in the system. |
| EmailDiscard | The agent discarded the email without sending a reply. |
| EmailReply | The agent is replying to the received email. |
| EmailForward | The email is being forwarded to another address or agent. |
| EmailTransfer | The email is being transferred to another agent or skill queue. |
| CallbackPending | The callback is queued and waiting to be initiated. |
| Refused | The agent refused the contact. |
| Preview | The agent is reviewing contact details in preview dialing mode before initiating the outbound call. |
| OutboundPending | The outbound contact is scheduled but not yet in progress. |
| PauseDetection | The system is detecting silence or pauses. This is often part of answering machine detection in outbound dialing. |
| OutboundAbandon | The system initiated an outbound call but disconnected before it was answered. This is often due to predictive dialing adjustments. |
| Answered | Either the customer or the agent answered the contact. |
| PrequeueAbandoned | The customer abandoned the call while in the PreQueue state. |
| OutboundCalledPartyHangUp | The called party disconnected the outbound call. |
| Parked | The contact is temporarily held in a parked state. It is not connected to an agent but can be retrieved. |
| InQueuePreview | The outbound preview dialer contact is waiting in queue to be connected to an agent. |
| OutboundAnswered | The customer successfully answered the outbound call. |
|
Contact State |
Definition |
|---|---|
|
New‑PreQueue |
A newly created DX interaction pending initial system processing. |
|
New‑InQueue |
A new DX interaction waiting in queue for an agent. |
|
New‑Active |
A new DX interaction currently being handled by an agent. |
|
Open‑PreQueue |
An open DX interaction preparing for routing or queueing. |
|
Open‑InQueue |
An open DX interaction waiting in queue for an agent. |
|
Open‑Active |
An open DX interaction currently being handled by an agent. |
|
Pending‑PostQueue |
A pending DX interaction awaiting follow‑up or wrap‑up actions. |
|
Pending‑Active |
A pending DX interaction actively being handled by an agent. |
|
Escalated‑PostQueue |
A DX interaction escalated to a higher skill queue. |
|
Escalated‑Active |
A DX interaction escalated and being handled by a specialized agent. |
|
Resolved‑PostQueue |
The issue has been resolved and is in the finalization stage. |
|
Resolved‑Active |
The agent has resolved the issue and is finalizing the interaction. |
|
Closed‑EndContact |
The DX interaction is fully closed with no further activity expected. |
|
Trashed‑EndContact |
The DX interaction was discarded manually or by system rules. |
Interaction Summary Widget
Data refresh rate: 5–10 minutes after the interaction ends
Widget refresh rate: 5 minutes
Duration support: Historical
The Interaction Summary widget gives you detailed information about completed interactions in your contact center. It lists one row per interaction and shows key attributes such as interaction ID, contact number, channel, skill, and timing. You can expand an interaction to open the CXone Interaction Details window and review the full interaction lifecycle, including transcript and recording if they are available. Currently, transcripts are only supported for digital channels.
You can use this widget to:
-
Review historical interactions across channels, such as voice and digital.
-
See which agents handled an interaction and for how long.
-
Drill down into the transcript and recording to understand what happened during the interaction.
You must have these permissions:
-
ACD > ACD Dashboard Widgets > Interaction Summary:On
-
Dashboard > Dashboards: View
-
Dashboard > Dashboards: Edit (optional)
If you cannot access the widgets or Dashboard, check with your administrator. The administrator can find these permissions in NiCE CXone. Go to Admin > Security Settings > Roles and Permissions and select the role.
When you click an interaction in the widget, the CXone Interaction Details window opens. This window includes:
-
Interaction Details: Header and timeline information for the interaction.
-
Transcript: A transcript of the interaction, when available.
-
CXone Recording: A link to the interaction’s recording, when available.
You can customize the columns:
-
Click Options, then Columns to select the columns you want to see, such as Interaction ID, Contact No, Channel, Skill, Agent, Start Time, End Time, and Duration.
-
Click to auto-size a specific column or all columns.
-
Click to select filter options.
You can personalize your column settings by adjusting the column size, sort, filter, and arrangement, then save these changes. You can sort the columns on the widget. To do a secondary sort of the columns, hold down Shift while sorting.
Click Options, then Settings on the widget to filter the data you want to see.
Field descriptions
-
Display Name: Define a name for the widget.
-
View Data: Controls which columns are shown in the widget. Use this setting to hide columns you do not need.
-
Date Range: Configures the time period for the data displayed in the widget. Available options typically include Today, Yesterday, Last 7 Days, Last 30 Days, Last 90 Days, Last Week, Last Month, and Custom Range.
-
ACD Filters: Configures which ACD attributes are included in the widget, such as skills, campaigns, or other routing attributes.
-
Channel: Configures which channels are included in the widget. This determines whether voice, specific digital channels, or both appear in the results.
Service Level
Data refresh rate: 15-30 minutes after the end of contact
Widget refresh rate: 90 seconds
Duration support: Historical - 1 day
This widget shows the percentage and the number of contacts that interacted with an agent for a particular skill and met the defined service level threshold as compared to the ones that did not meet it for the current day.
The Service Level widget displays data for only contacts that have ended. Data is updated once a contact has ended. Live contacts are not included in the widget's data representation and, therefore, are not included in the calculation of the InSLA and OutSLA metrics.
By default, the widget opens in Chart view. Click Options , then Widget Display to change the view to Table, or Table and Chart side by side.
You must have these permissions:
-
ACD > ACD Dashboard Widgets > Service Level:On
-
Dashboard > Dashboards: View
-
Dashboard > Dashboards: Edit (optional)
If you cannot access the widgets or Dashboard, check with your administrator. The administrator can find these permissions in NiCE CXone. Go to Admin > Security Settings > Roles and Permissions and select the role.
Click Options, then Settings on the widget to filter the data you want to see.
Field descriptions
-
Display Name: Define a name for the widget.
-
Time: Select to Include or Exclude a particular time period.
-
Campaign: Select the campaign that you want to include in the widget.
-
Skill: Select the agent skills
Used to automate delivery of interactions based on agent skills, abilities, and knowledge. to include in the widget. -
Channel: Select the channel that you want to view in the widget.
-
Direction: Select the direction of the contact, for example inbound, outbound
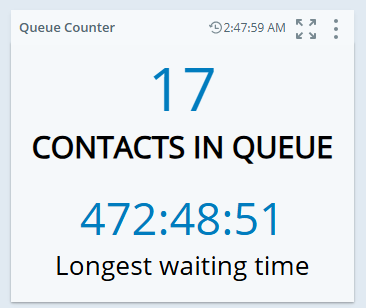
Queue Counter
Data refresh rate: 7-10 seconds
Widget refresh rate: 7 seconds
Duration support: Near real-time
The Queue Counter widget shows the number of contacts currently in queue and the longest duration of time a contact had to wait to connect to an agent.
You must have these permissions:
-
ACD > ACD Dashboard Widgets > Queue Counter: On
-
Dashboard > Dashboards: View
-
Dashboard > Dashboards: Edit (optional)
If you cannot access the widgets or Dashboard, check with your administrator. The administrator can find these permissions in NiCE CXone. Go to Admin > Security Settings > Roles and Permissions and select the role.
You can use this widget to decide if you need to increase the number of agents or if agents can take extra time to handle specific customers.
Click Options, then Settings on the widget to filter the data you want to see.
Field descriptions
-
Display Name: Define a name for the widget.
You can select the wait time you want displayed on the widget from these options:
- Longest delay inqueue and callback: It shows the longest delay and includes all contacts inqueue and in the callback state.
-
Longest delay inqueue: It shows the longest delay and includes all contacts in the inqueue state only.
-
Longest delay callback: It shows the longest delay and includes all contacts in the callback state only.
-
Campaign: Select the campaign that you want to include in the widget.
-
Skill: Select the agent skills
Used to automate delivery of interactions based on agent skills, abilities, and knowledge. to include in the widget. -
Channel: Select the channel that you want to include in the widget.
-
Contact State: Select the contact state that you want to view in the widget.
-
Point of Contact: Select a point of contact
The entry point that an inbound contact uses to initiate an interaction, such as a phone number or email address. or an entry point the customer has used for the interaction to include in the widget.
Callback Requests
Data refresh rate: In Queue 7-10 seconds, successful and failed 5-10 minutes after the contact ends
Widget refresh rate: 7 seconds
Duration support: Near real-time
Using this widget, you can view all the callback interactions for the current day, along with the status of each callback interaction.
This widget gives an overview of the active callback requests:
-
Number of callback requests Inqueue: The number of customers in the queue to receive a callback. A callback request has been made, but the agent has not yet made the callback.
-
Number of Successful callback requests: The number of customers that requested a callback and successfully connected with an agent.
-
Number of Failed callback requests: The agent could not connect with the customer due to a busy signal, or the customer did not respond.
By default, the widget opens in Chart view. Click Options , then Widget Display to change the view to Table, or Table and Chart side by side.
You must have these permissions:
-
ACD > ACD Dashboard Widgets > Callback Requests: On
-
Dashboard > Dashboards: View
-
Dashboard > Dashboards: Edit (optional)
If you cannot access the widgets or Dashboard, check with your administrator. The administrator can find these permissions in NiCE CXone. Go to Admin > Security Settings > Roles and Permissions and select the role.
Click Options, then Settings on the widget to filter the data you want to see.
Field descriptions
-
Display Name: Define a name for the widget.
-
Campaign: Select the campaign that you want to include in the widget.
-
Skill: Select the agent skills
Used to automate delivery of interactions based on agent skills, abilities, and knowledge. to include in the widget. -
Channel: Select the channel that you want to include in the widget.
-
Contact State: Select the contact state that you want to view in the widget.
-
Point of Contact: Select a point of contact
The entry point that an inbound contact uses to initiate an interaction, such as a phone number or email address. or an entry point the customer has used for the interaction to include in the widget.
Dispositions
Data refresh rate: 4 hours
Duration support: 25 months
The Dispositions Widget helps you manage and understand disposition data on your dashboard. It organizes customer interactions into different categories, making it easier to follow and improve these interactions. By presenting important data clearly, it provides a better understanding of performance metrics.
New dispositions require a processing period of up to 24 hours before appearing in the dashboard.
This widget is only available for organizations with the PM license.
You must have these permissions:
-
ACD > ACD Dashboard Widgets > Dispositions: On
-
Dashboard > Dashboards: View
-
Dashboard > Dashboards: Edit (optional)
If you cannot access the widgets or Dashboard, check with your administrator. The administrator can find these permissions in NiCE CXone. Go to Admin > Security Settings > Roles and Permissions and select the role.
On Widget Display, you can display the data in your widget as a Table, Chart, or Table and Chart
On Columns, you can select the columns you want to be displayed on the widget, such as Disposition, Disposition %, Handled, and AHT.
Click Options, then Settings on the widget to filter the data you want to see.
Field descriptions
-
Display Name: Define a name for the widget.
-
Date range: Define the date range. You can choose from options, like Today, Yesterday, Last 7 days, Last 30 days, Last 90 days, Last Week, Last Month and Custom range.
-
Team: Select the teams to include in the widget. Only the agents from the teams you select are displayed.
-
Agent: Select the agents to include in the widget from your selected teams in the Teams filter. Inactive agents are displayed on the dashboard only if the selected date range includes a period when they were active. If the date range includes a period before and after they've become inactive, they will not be displayed.
-
Campaign: Select the campaign that you want to include in the widget.
-
Skill: Select the agent skills
Used to automate delivery of interactions based on agent skills, abilities, and knowledge. to include in the widget.
You can customize the columns:
-
Click
to auto size a specific column or all the columns. -
Click
to select filter options. -
Click
to select the columns you want to see on the widget.
You can personalize your column settings by adjusting the column size, sort, filter, and arrangement, and then save these changes, even with the View dashboard permission.
Sorting table columns
You can sort the data in the table by clicking a column header. To apply a secondary sort, hold down the Shift key and click another column header.
-
The primary sort column displays a 1 next to the column title.
-
The secondary sort column displays a 2 next to the column title.